Announcing Auto-Optimization: Self-Tuning AI Memory from Real User Feedback

Moving Beyond Static Memory
Most AI-memory systems suffer from a fundamental problem: they're static. You build the knowledge graph, tweak the prompts, and configure the parameters, only for the system’s behavior to be unaffected by how people actually use it—nothing changes unless it’s manually re-optimized.
This creates a never-ending cycle that scales poorly and requires expertise to maintain. We’ve decided to flip that dynamic by enabling real user feedback to reshape the parts of the graph actually used to answer questions, so relevance improves with every interaction.
The auto-optimizing feedback loop—available in cognee’s latest version—is a safe, efficient, and transparent way to evolve fairly complex knowledge graphs while reducing ongoing developer effort by shifting a portion of the optimization to user-generated signal.
How Feedback Becomes Learning
Auto-optimization comes with cognee’s feedback system. When people react to an answer, cognee normalizes that reaction into a sentiment score and attributes it to the answer that was shown, then to the graph elements that produced it. Improvements accumulate on those edges—exactly where future answers are routed.
Here’s how this all happens:
1- Users React: People leave feedback (“amazing,” “okay but could be better,” ”I like that you included x, but y is missing,” etc.).
2- Feedback Becomes a Score (−5…+5): An LLM maps the text and sentiment to a numerical score. This normalization gives you a consistent signal across different phrasings, with configurable per-signal weights.
3- The Interaction Is Tied to What Answered: When the interaction is saved, cognee links the interaction node to the exact triplet endpoints that produced the answer using used_graph_element_to_answer edges. That’s the attribution step—now each signal knows which elements it’s judging.
4- Scores Update Edge Weights (Aggregate Over Time): Ingestion of a feedback node links it to the interaction, finds the corresponding used_graph_element_to_answer edges, and adds the score to their weights.
Multiple people can rate the same interaction; their scores aggregate on those edges. Because every score is stored, you can verify that the sum of individual feedback scores equals the edge weight. Example: two feedbacks (+5 and +2) become an aggregated weight of 7; with 50 users, totals would range −250…+250, etc.
5- The Loop Self-Optimizes: Because scores land exactly on the edges that answered the question, relevance improves where users are signaling quality. Over time, stronger paths are reinforced, weaker ones are visible (not erased), and every change is traceable back to individual feedback.
This process is safe and transparent because nothing destructive happens. Weak answers aren’t deleted but are rather compounded with the other signals. Every individual score remains visible for scrutiny, and aggregates are easy to audit.
Quickstart Guide: Add, Search, Rate
Before running queries, first enable saving interactions, then send your feedback on cognee’s retrievals:
Visual Walkthrough: From Questions to Weights
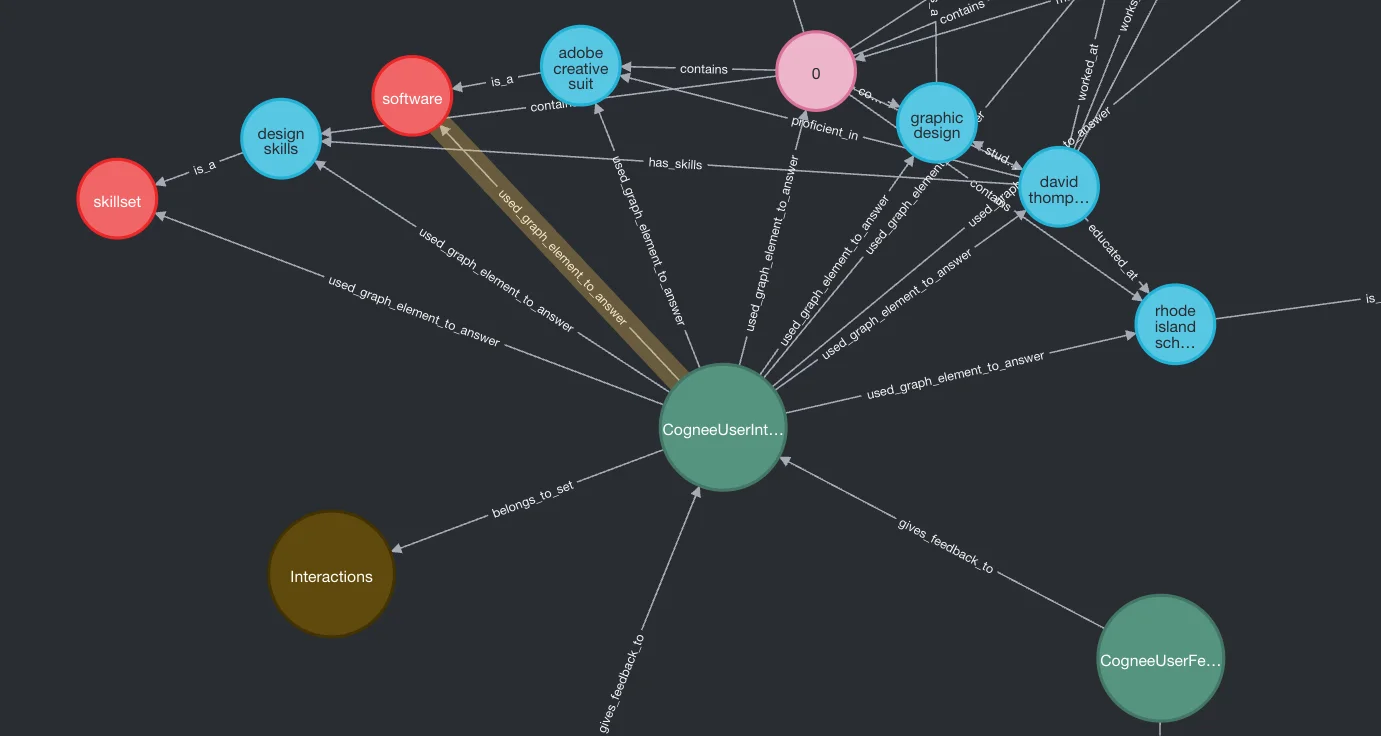
To make the mechanics clearer, let’s check out a concrete example. The screenshots below show how user interactions are recorded, how feedback is attached, and how that feedback propagates into the graph as updated edge weights. Every step, from the original question to the aggregated score, is recorded and visible inside the graph.
This is the query-relevant knowledge graph subsection—we ask the question (e.g. "Who has experience in design tools?"), get the answer, then User 1 and User 2 provide feedback to it.
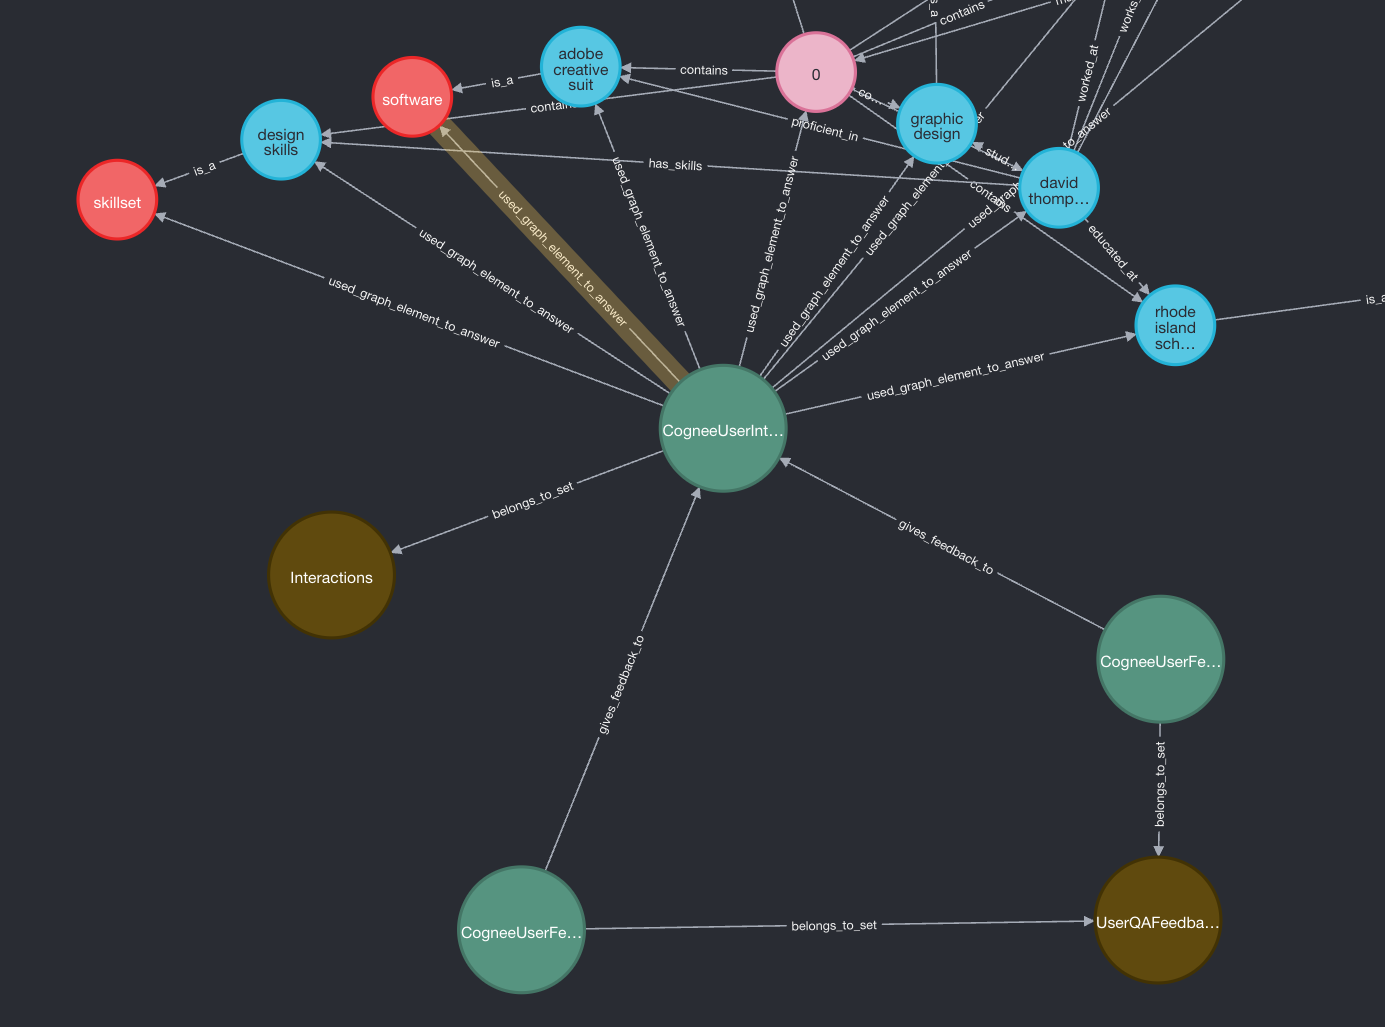
Feedback: The CogneeUserInteraction node is connected with two CogneeUserFeedback nodes (for two feedbacks received) via the gives_feedback_to edge.
Attribution: Multiple used_graph_element_to_answer edges fan out to the specific triplet endpoints used to produce the answer.
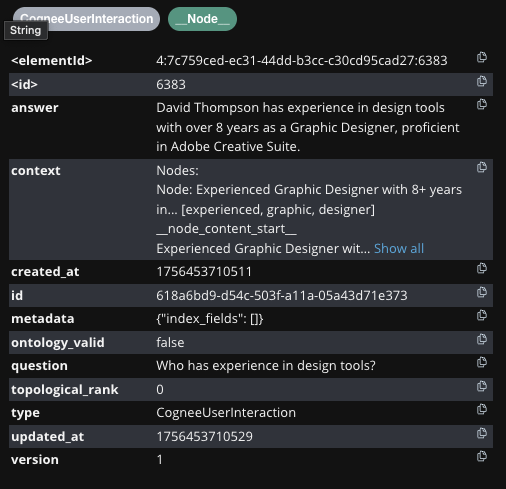
What's stored: the question, context, and answer (e.g., the interaction showing the question with an answer citing the person with the required experience and proficiency).
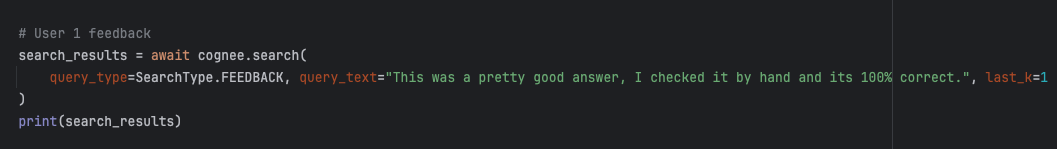
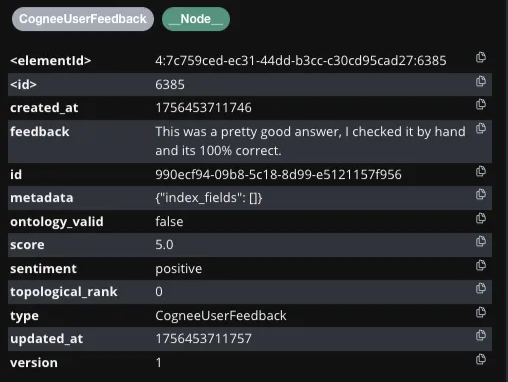
User 1: free-text feedback, a score in −5…+5, and a sentiment category (positive/neutral/negative).
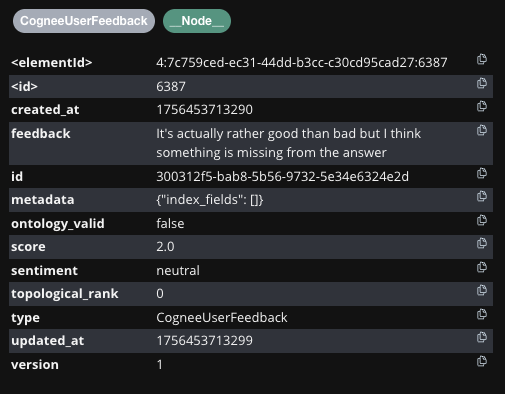
User 2: same structure—feedback text, score, and sentiment properties.
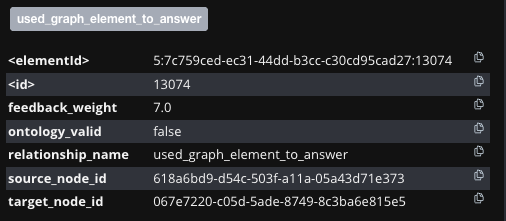
Aggregation: the aggregated feedback weight on a used_graph_element_to_answer edge. In the example, two feedbacks (+5 and +2) yield 7. With 50 feedback events on one QA pair, totals range −250…+250.
What’s next? We’re working on automating recalculation so updates happen continuously, and on refining the scoring mechanism for stronger signal quality as feedback grows.


