AI Observability Tools: 8 Platforms for Tracing AI Agents in 2026

An AI agent can finish a task and still leave you with no clear idea why it made the decisions it did. The final response often looks acceptable at first glance, but a closer look can reveal that the agent retrieved irrelevant context, called the wrong tool, repeated unnecessary steps, or carried outdated memory into a later decision.
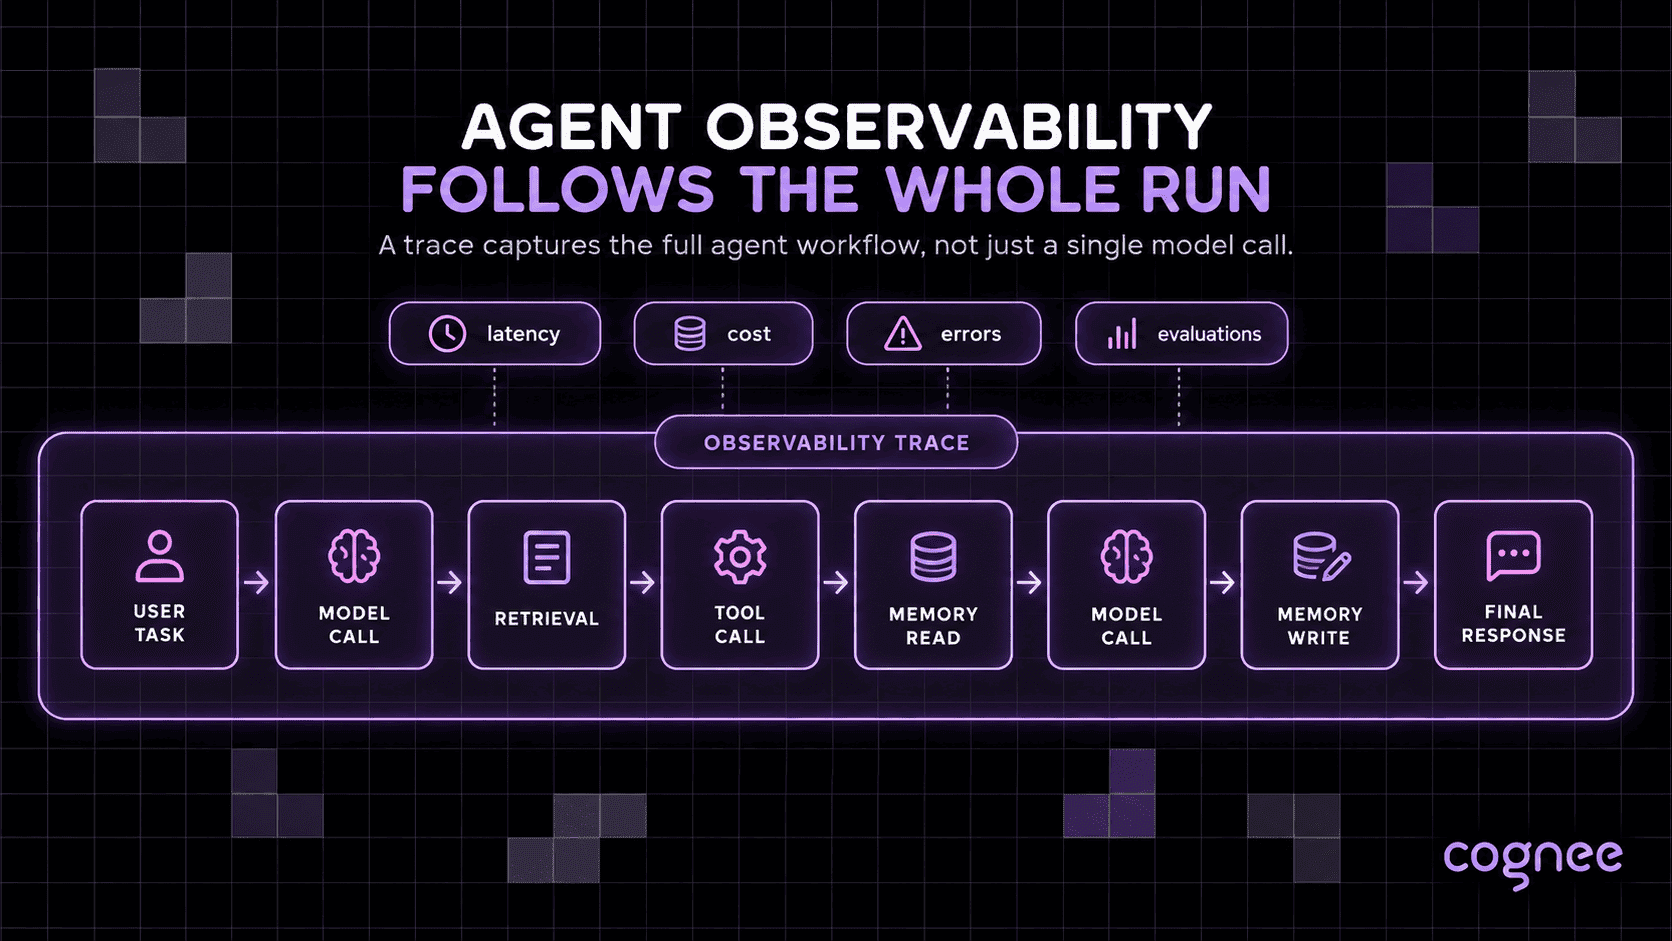
Agent observability provides that valuable record of agentic execution through traces that connect model calls with retrieval, tools, state changes, evaluations, latency, and cost, making the sequence behind the result easier to inspect.
Some AI observability tools specialize in detailed tracing, while others focus more heavily on evaluations or connect agent telemetry with more general application monitoring. For stateful agents, another important criterion is how clearly a platform can capture the memory and retrieval operations influencing later actions.
In this post, we'll compare eight prominent observability tools across tracing, evaluations, retrieval and memory visibility, deployment, and telemetry standards. Our platform, cognee, provides persistent AI memory rather than observability software, so it isn't part of the comparison. Still, we'll look at how memory systems like cognee can integrate with observability tools later on.
What Is Agent Observability?
A single LLM call can be inspected through its prompt, output, model, latency, token usage, and error status. An agent workflow, on the other hand, can involve several model calls alongside retrieval, tool execution, retries, state changes, and agent handoffs, making the full session a more informative unit of analysis.
If a research agent produces a poor answer after six tool calls, debugging requires enough of the execution record to identify which sources were retrieved, which actions followed, and where the run diverged from the intended behavior.
LLM observability and agent observability are distinct in their units of analysis, the activity each one captures, and the debugging question each one answers:
| LLM observability | Agent observability | |
|---|---|---|
| Primary unit | Model call | Agent run or session |
| Typical visibility | Prompt, response, tokens, latency, errors | Model calls, retrieval, tools, state, handoffs, evaluations |
| Main debugging focus | What happened during this model call? | Which sequence of events produced this agent outcome? |
There is an overlap here because agent traces contain LLM activity, while agent observability preserves the surrounding execution needed to understand that activity in context.
What Should an AI Observability Tool Track?
The criteria in this table weigh how much of the agent run each platform can reconstruct and how that telemetry can be used afterward:
| What to check | |
|---|---|
| Agent tracing | Complete runs, nested agents, tool calls, retries, handoffs, and execution order |
| Evaluations | Production scoring, offline experiments, regression testing, datasets, and human or automated feedback |
| Retrieval and memory visibility | Queries, returned context, memory reads and writes, updates, scope, and information passed into later model calls |
| Operational monitoring | Latency, token usage, model cost, errors, dashboards, and alerts |
| Standards and deployment | OpenTelemetry or OpenInference support, telemetry export, self-hosting, and control over observability data |
OpenTelemetry GenAI semantic conventions now define named operations for memory activity — search_memory, create_memory, update_memory, upsert_memory, and delete_memory among them. Those conventions are still under development, and a platform that ingests OpenTelemetry doesn't necessarily give those memory spans dedicated UI or analysis; check that directly whenever memory influences agent behavior.
8 AI Observability Tools for Agents in 2026
Here's a quick overview of the eight platforms we'll cover in this section (in no particular order) across their main strengths, retrieval and memory visibility, and deployment options.
| Tool | Primary strength | Retrieval / memory visibility | Deployment |
|---|---|---|---|
| LangSmith | Agent tracing tied closely to evaluation | Dedicated retriever traces; custom tracing for other operations | Cloud; hybrid; Enterprise self-hosting |
| Langfuse | OpenTelemetry-based observability with an MIT-licensed core | Generic observations and sessions can capture retrieval or memory operations | Cloud or self-hosted |
| Arize Phoenix | OpenInference/OpenTelemetry tracing and RAG evaluation | Explicit retrieval traces; custom spans for application logic | Local, containerized, or Phoenix Cloud |
| Braintrust | Evaluation-centered production observability | Agent-observability guidance explicitly includes memory reads and writes | Cloud; customer-hosted data plane available |
| Comet Opik | Open-source tracing and trajectory evaluation | Custom spans can include retrieval and memory activity | Cloud or self-hosted |
| W&B Weave | Agent tracing and evaluation within the W&B ecosystem | Instrumented operations can include retrieval or memory calls | W&B platform |
| Datadog Agent Observability | AI traces connected with application and infrastructure monitoring | Custom/manual spans can capture memory operations | Datadog platform |
| AgentOps | Agent-specific hierarchical execution traces | Custom operation spans can represent memory activity | Hosted or self-hosted |
1. LangSmith
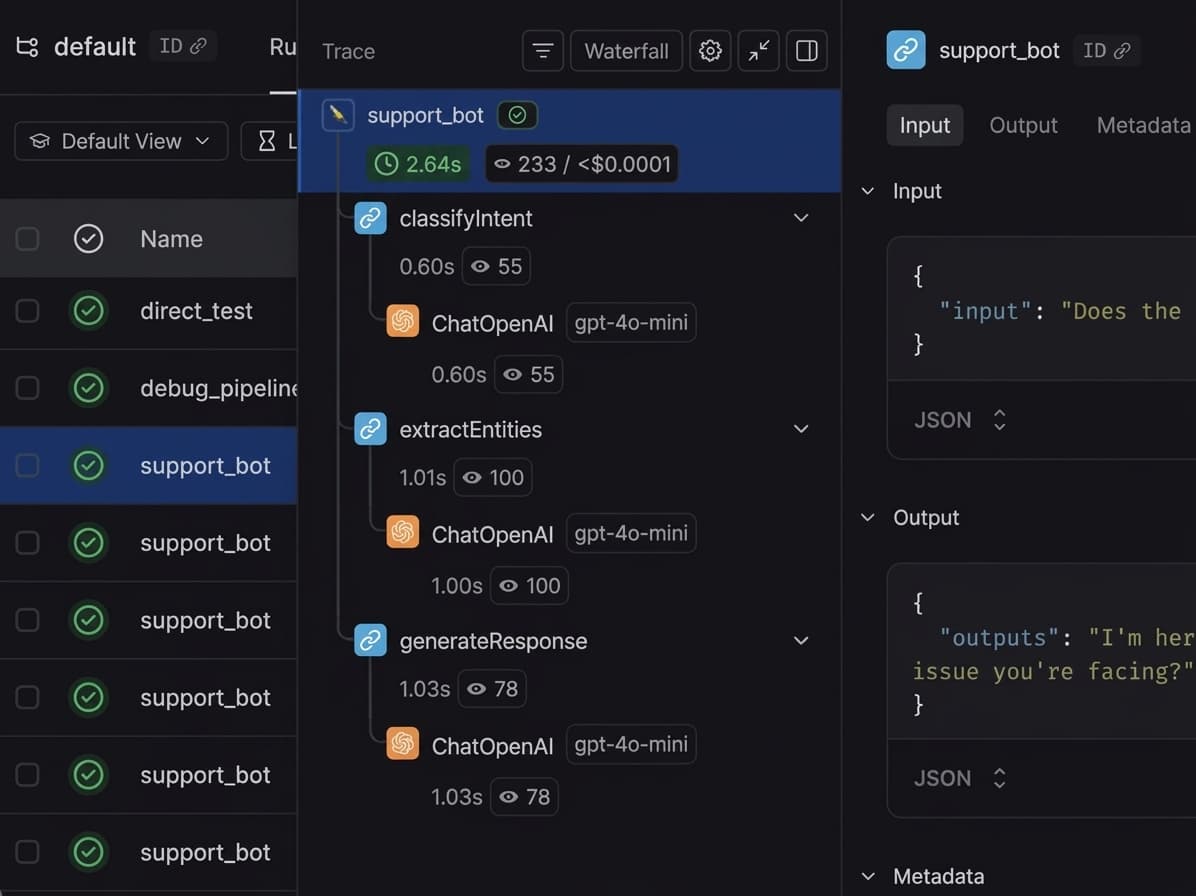
LangSmith combines tracing and evaluation across complete LLM and agent runs. LangChain and LangGraph applications have direct instrumentation, while other frameworks can send telemetry through the LangSmith SDK or OpenTelemetry.
Retrieval receives dedicated handling. A retriever run can display the documents returned during a search together with their metadata, making it easier to inspect the context supplied before generation. Other application operations can be recorded through ordinary trace spans.
Production runs can feed online evaluators or become examples in datasets for offline experiments and regression testing. Evaluators can use code, human review, pairwise comparison, or LLM-as-a-judge scoring.
LangSmith is available as a managed service, with hybrid and Enterprise self-hosted configurations for greater control over observability data.
2. Langfuse
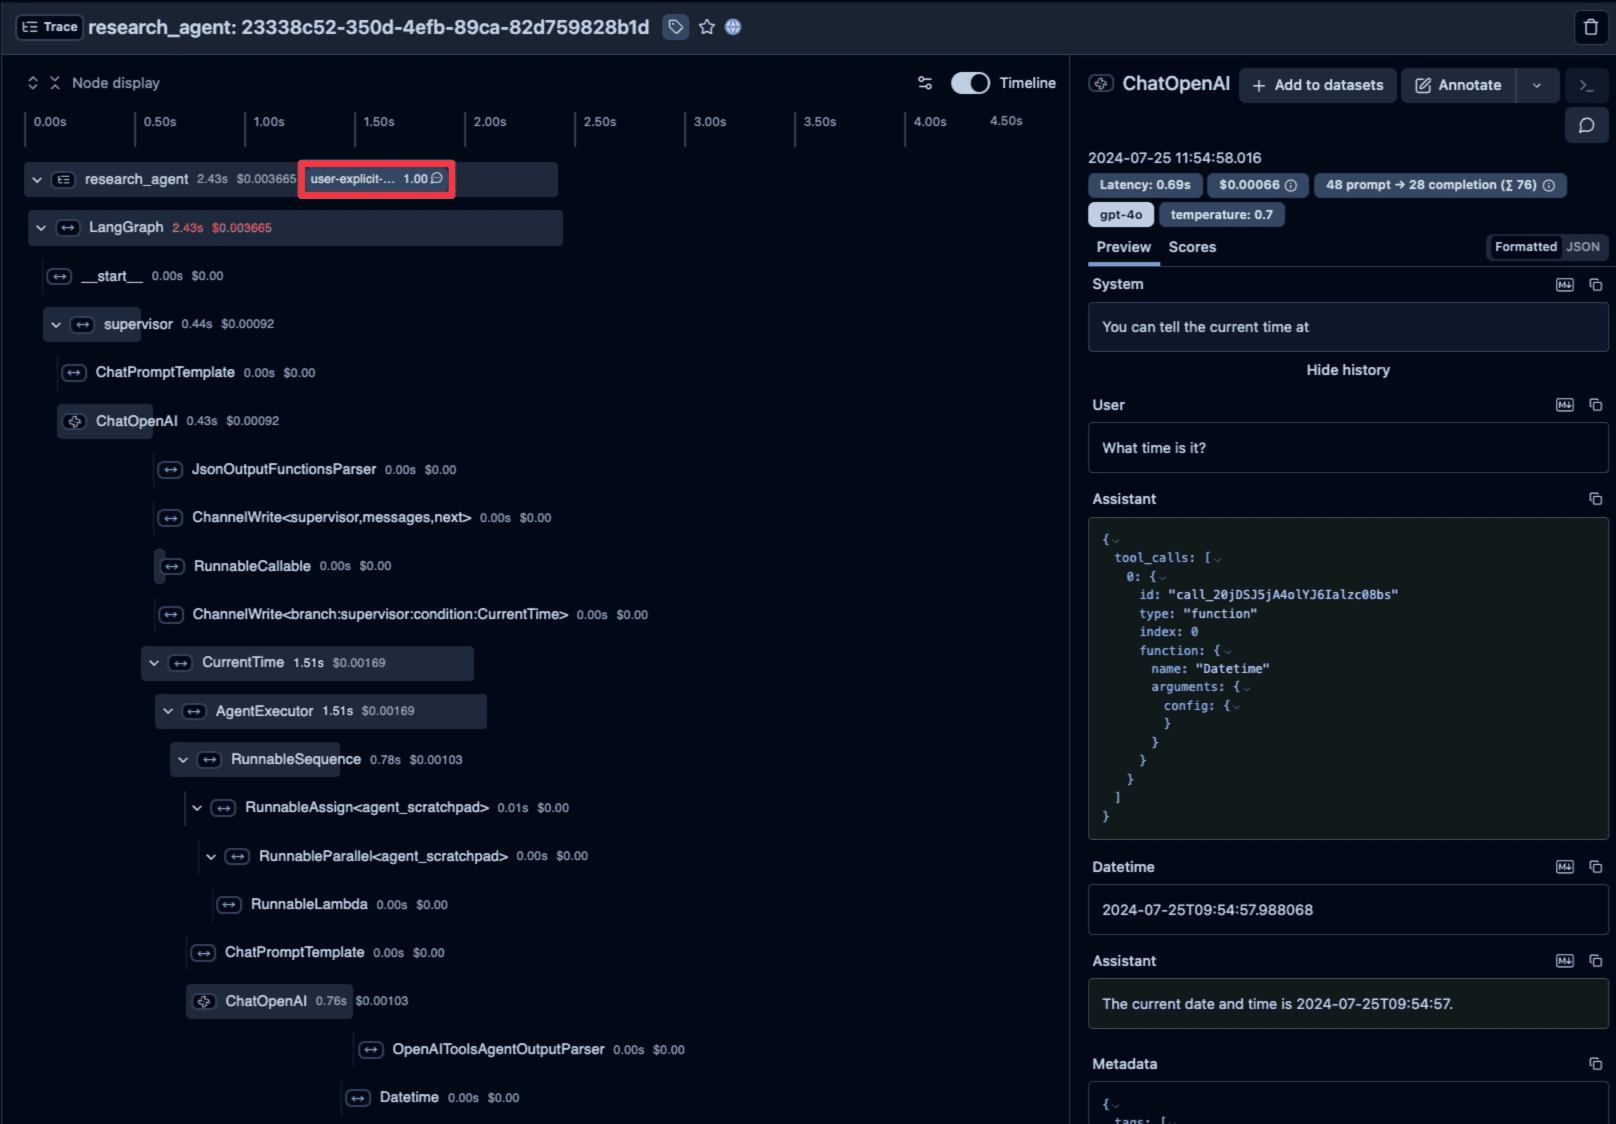
Langfuse is an open-core AI engineering platform with an MIT-licensed core. Its current SDKs use OpenTelemetry, and applications can also send OTEL telemetry directly.
Observations can record LLM calls and surrounding application operations, while sessions group related traces across longer conversations or agent workflows. That session layer helps inspect behavior spanning several requests without reducing the analysis to individual model calls.
Langfuse connects production telemetry with evaluations, datasets, experiments, annotations, and automated scoring. It can run through Langfuse Cloud or on infrastructure controlled by the organization, with several documented production self-hosting options.
Some Enterprise functionality is commercially licensed, so if you're choosing Langfuse partly for its open-source deployment story, check which governance and administrative capabilities belong to the core versus the Enterprise edition.
3. Arize Phoenix
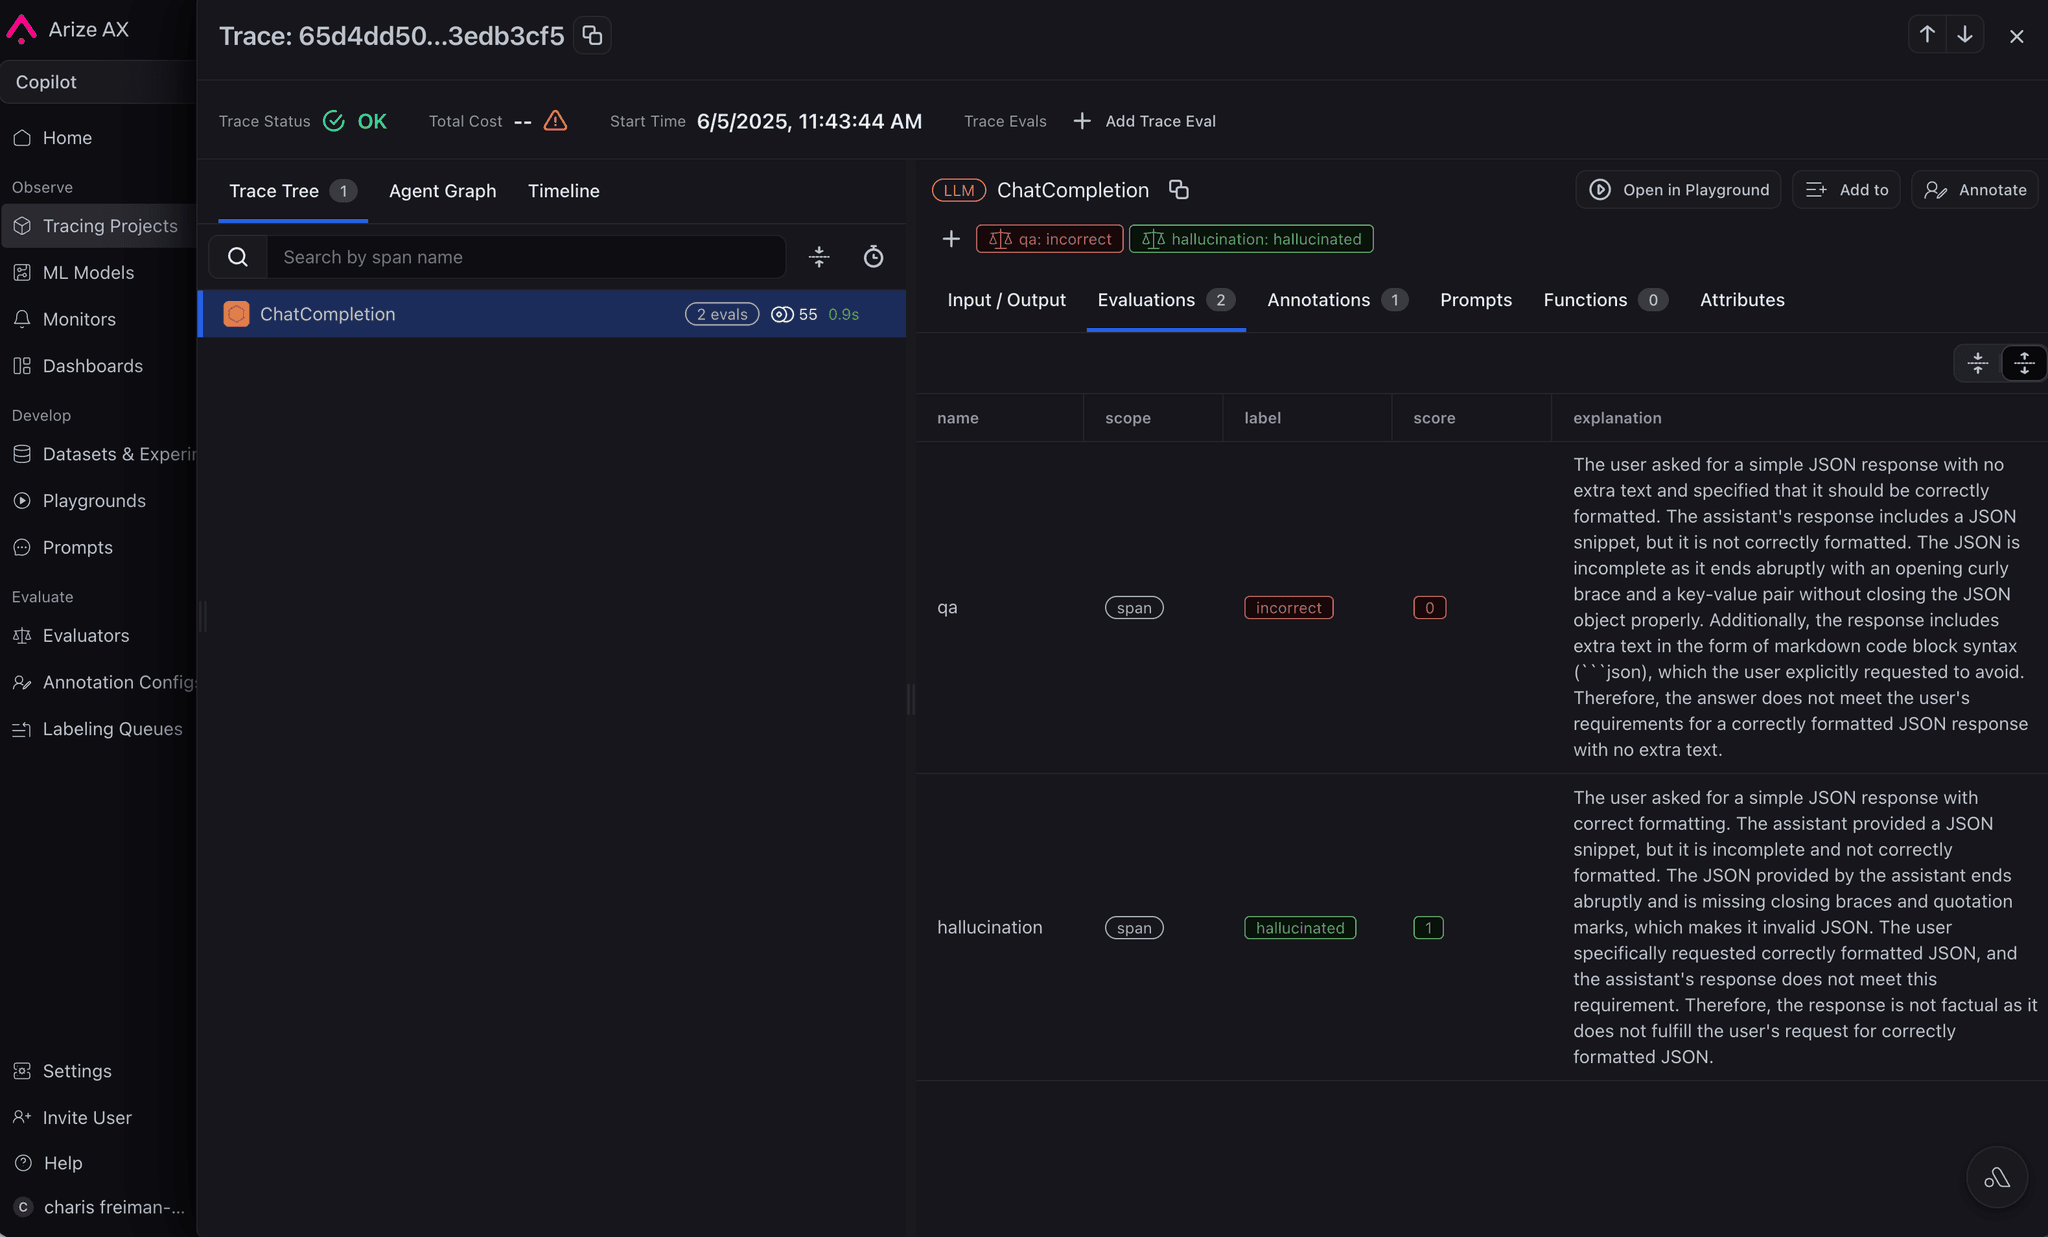
Arize Phoenix provides tracing and evaluation through OpenTelemetry and OpenInference, the semantic conventions developed by Arize for AI application telemetry.
Phoenix traces can include model calls, retrieval, tools, and custom application logic. Its RAG-oriented instrumentation makes retrieved context visible along with the model operation that consumes it, while evaluations can score spans and traces with model-based checks, code, or human labels.
Phoenix can run locally, through containers, or as a hosted service. It's released under Elastic License 2.0, which permits self-hosting but includes restrictions on providing the software itself as a hosted or managed service.
4. Braintrust
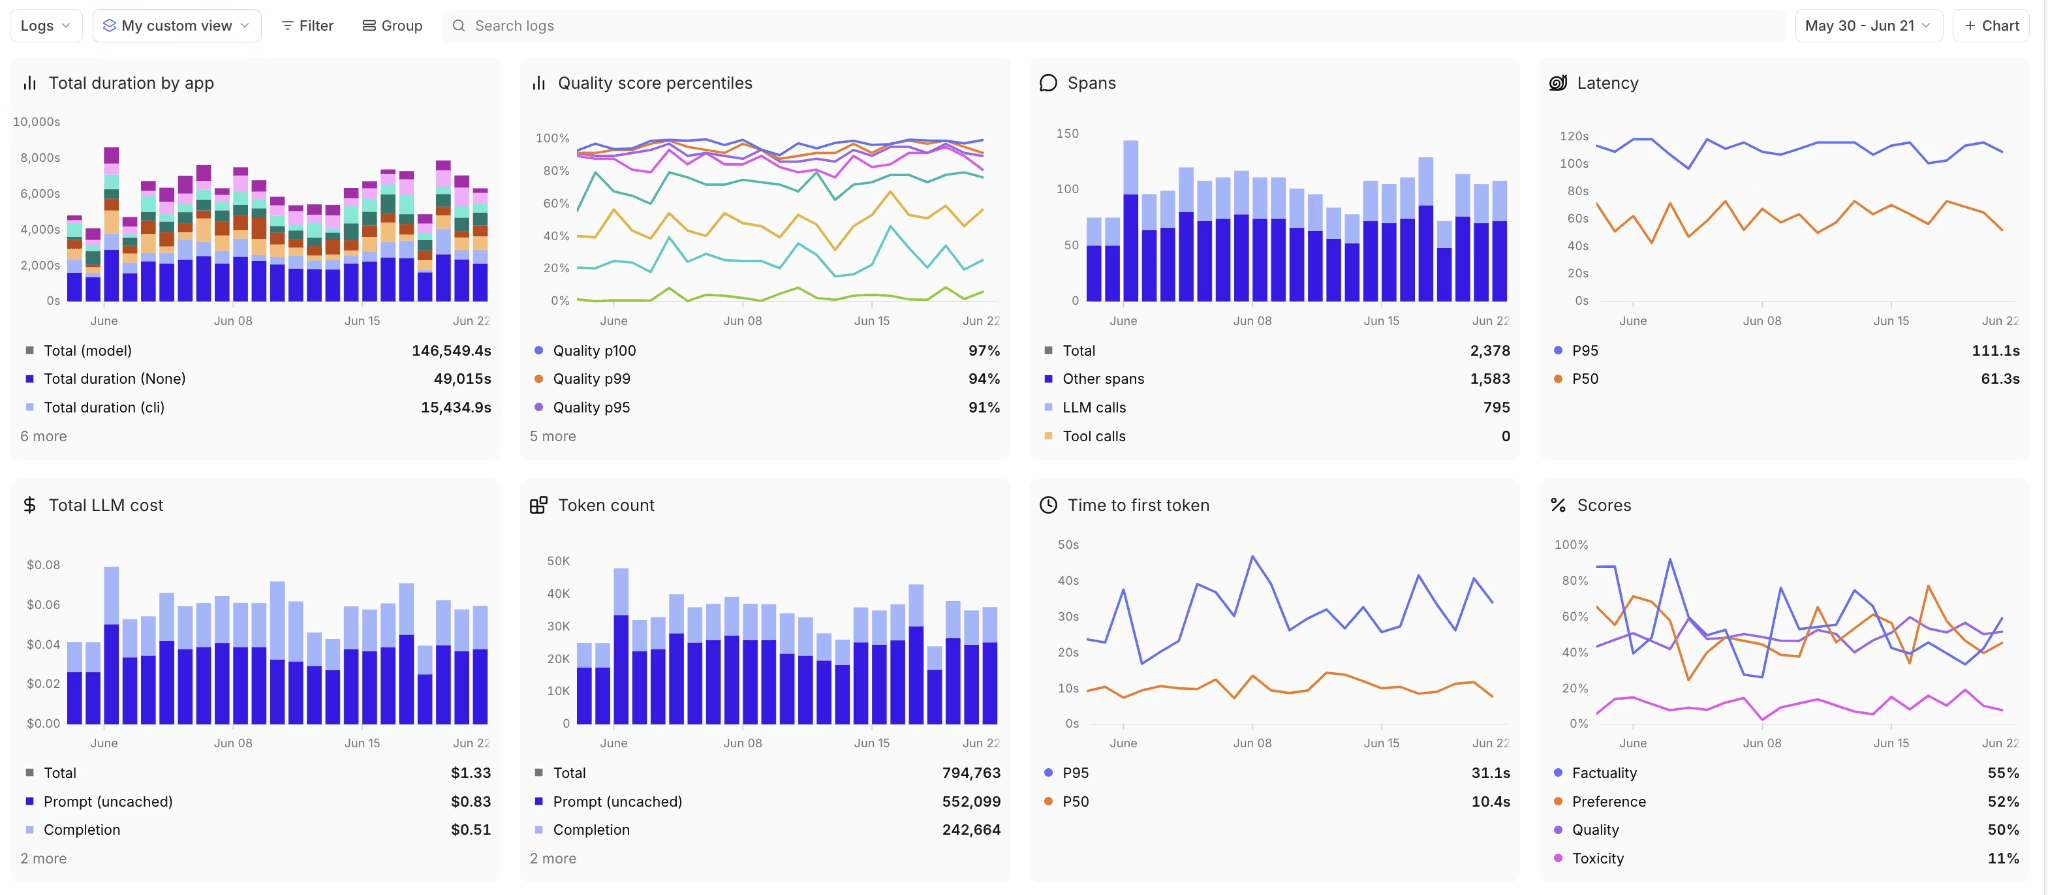
Braintrust integrates evaluation directly into its production observability workflow. Agent runs can be traced as nested operations, while production failures can feed datasets and later regression tests using the same evaluation infrastructure.
Braintrust's guidance on agent observability includes memory reads and writes among the operations a trace should capture. For agents using persistent memory, those traces can show what information was retrieved or stored and how it affected later model or tool steps.
Braintrust supports automated and model-based evaluation, production scoring, datasets, and experiments. Those with stricter data requirements can deploy the Braintrust data plane in their own cloud while the managed control plane handles the UI, authentication, and platform management.
5. Comet Opik
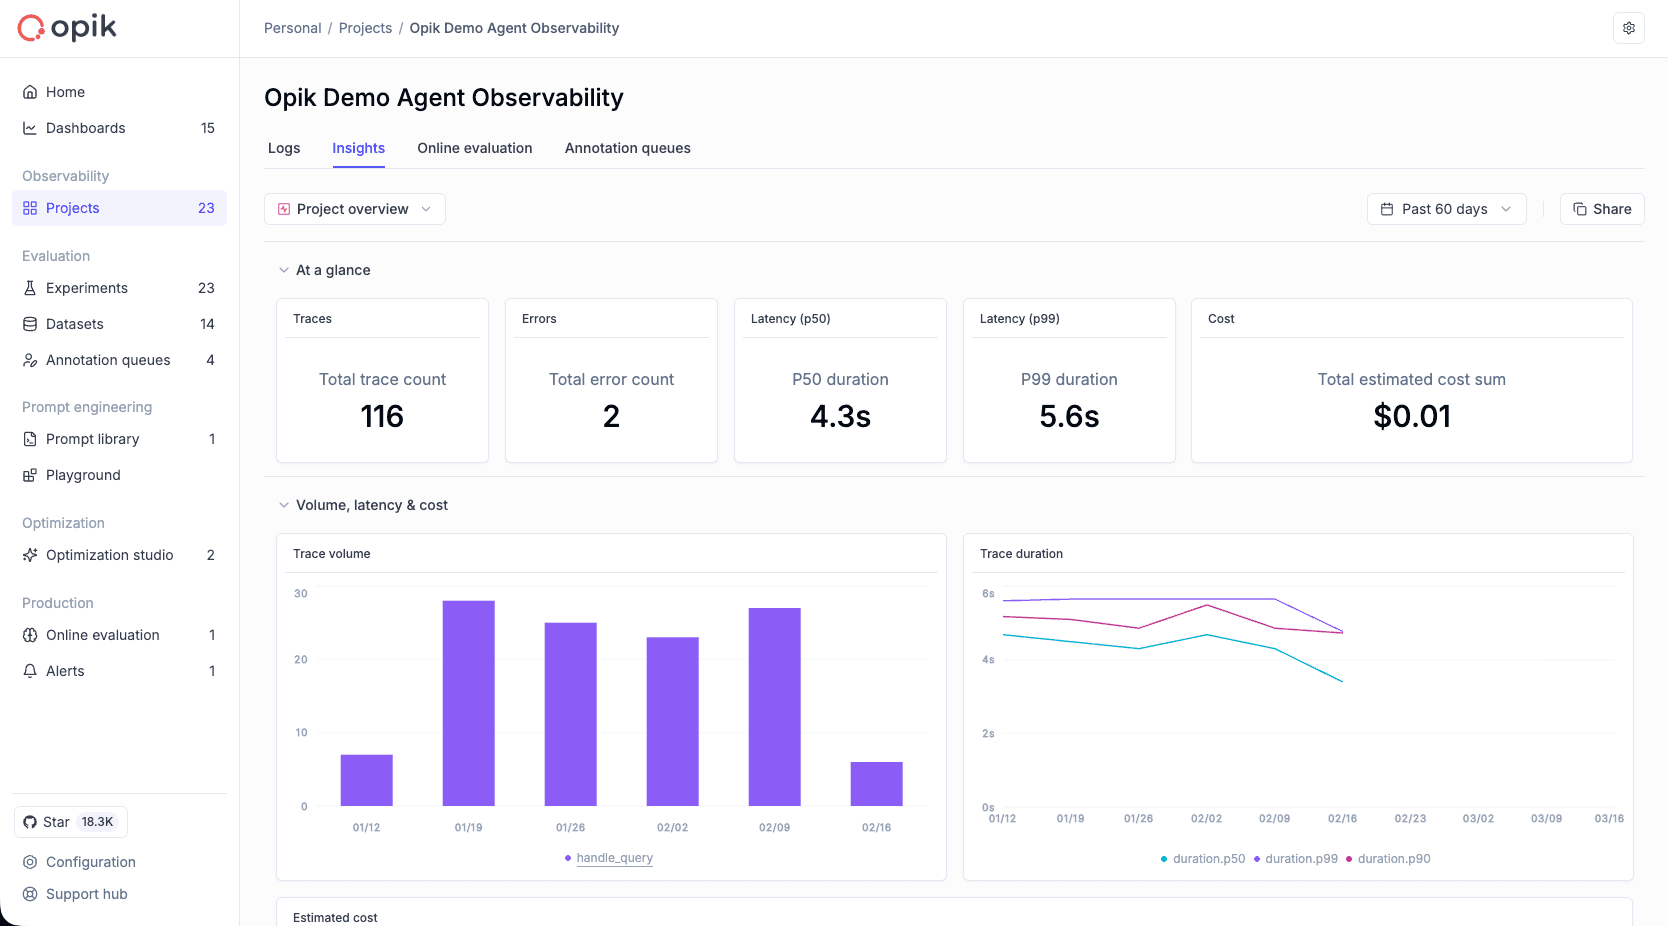
Comet's Opik is an Apache-2.0 observability and evaluation platform available through Opik Cloud or as a self-hosted deployment.
Trajectory evaluation scores the sequence an agent followed through a task rather than checking only the final response — the same kind of multi-step grading AgentBench applies to LLM agents. This can reveal mistakes in tool choice or intermediate reasoning that aren't obvious from the final output.
Opik accepts OpenTelemetry traces and supports datasets and experiments for repeatable evaluation. Custom spans can capture application-specific operations such as retrieval or memory access as part of the same agent trajectory.
6. W&B Weave
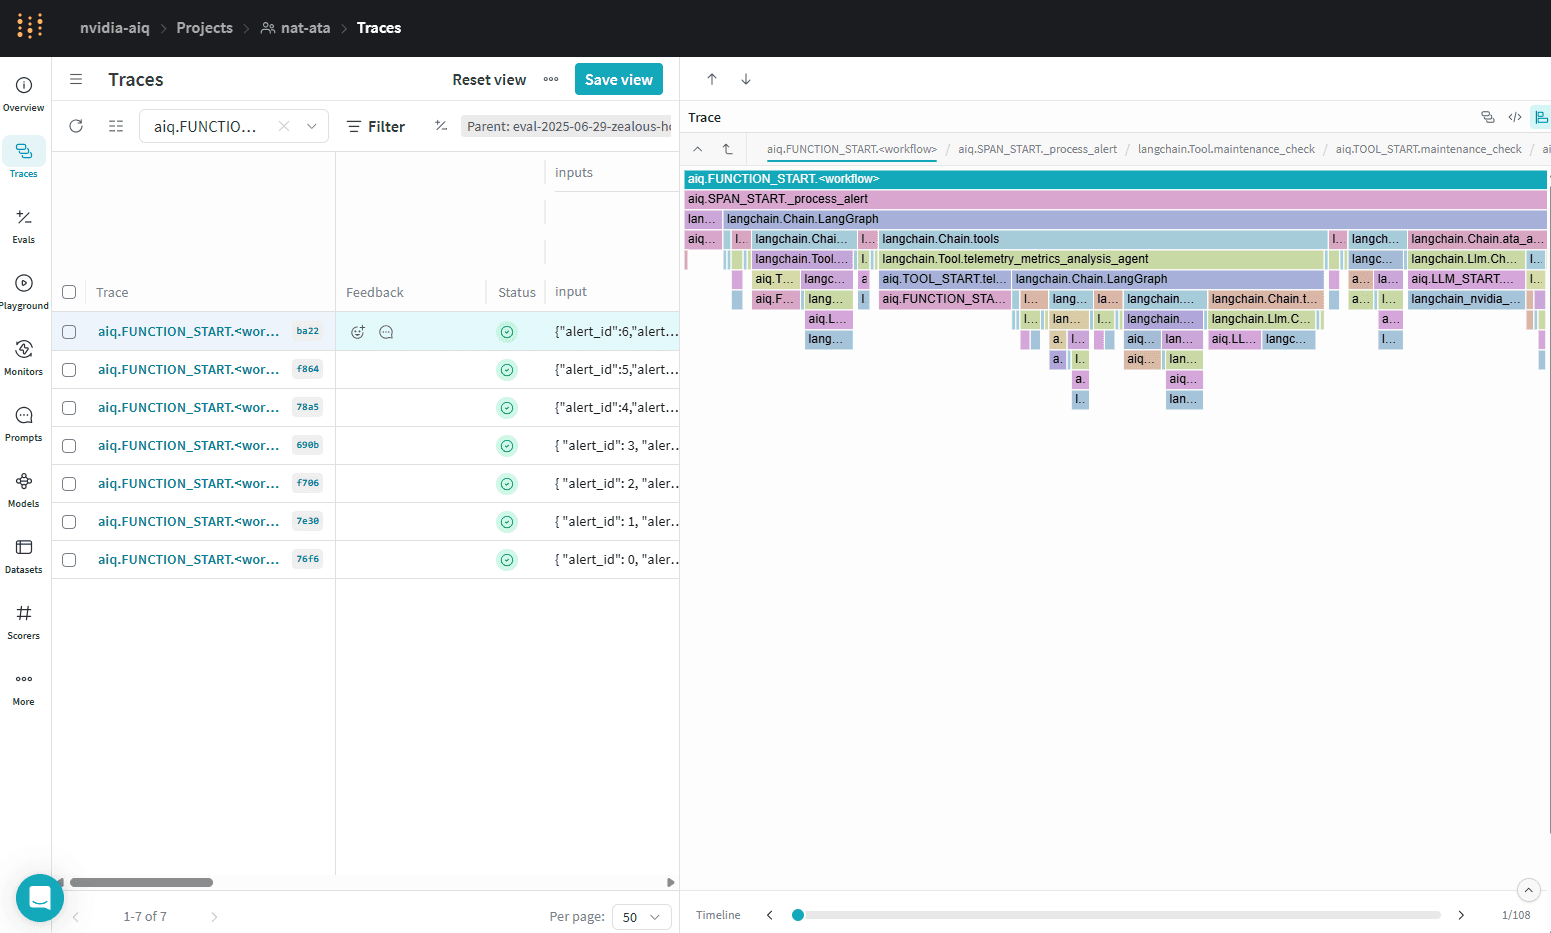
W&B Weave connects AI tracing and evaluation with the Weights & Biases platform.
A conversation traced through turns and tool calls can be scored as single- or multi-turn behavior with an LLM judge, then compared across different versions of the same agent — that's Weave's core agent evaluation workflow. Custom scorers and evaluation datasets cover more application-specific criteria.
Organizations already using W&B elsewhere in model development get a shorter path between experimentation and production analysis by keeping agent traces and evaluations in the same environment. Retrieval or memory calls can also be instrumented as application operations when those steps need to appear in the trace.
7. Datadog Agent Observability
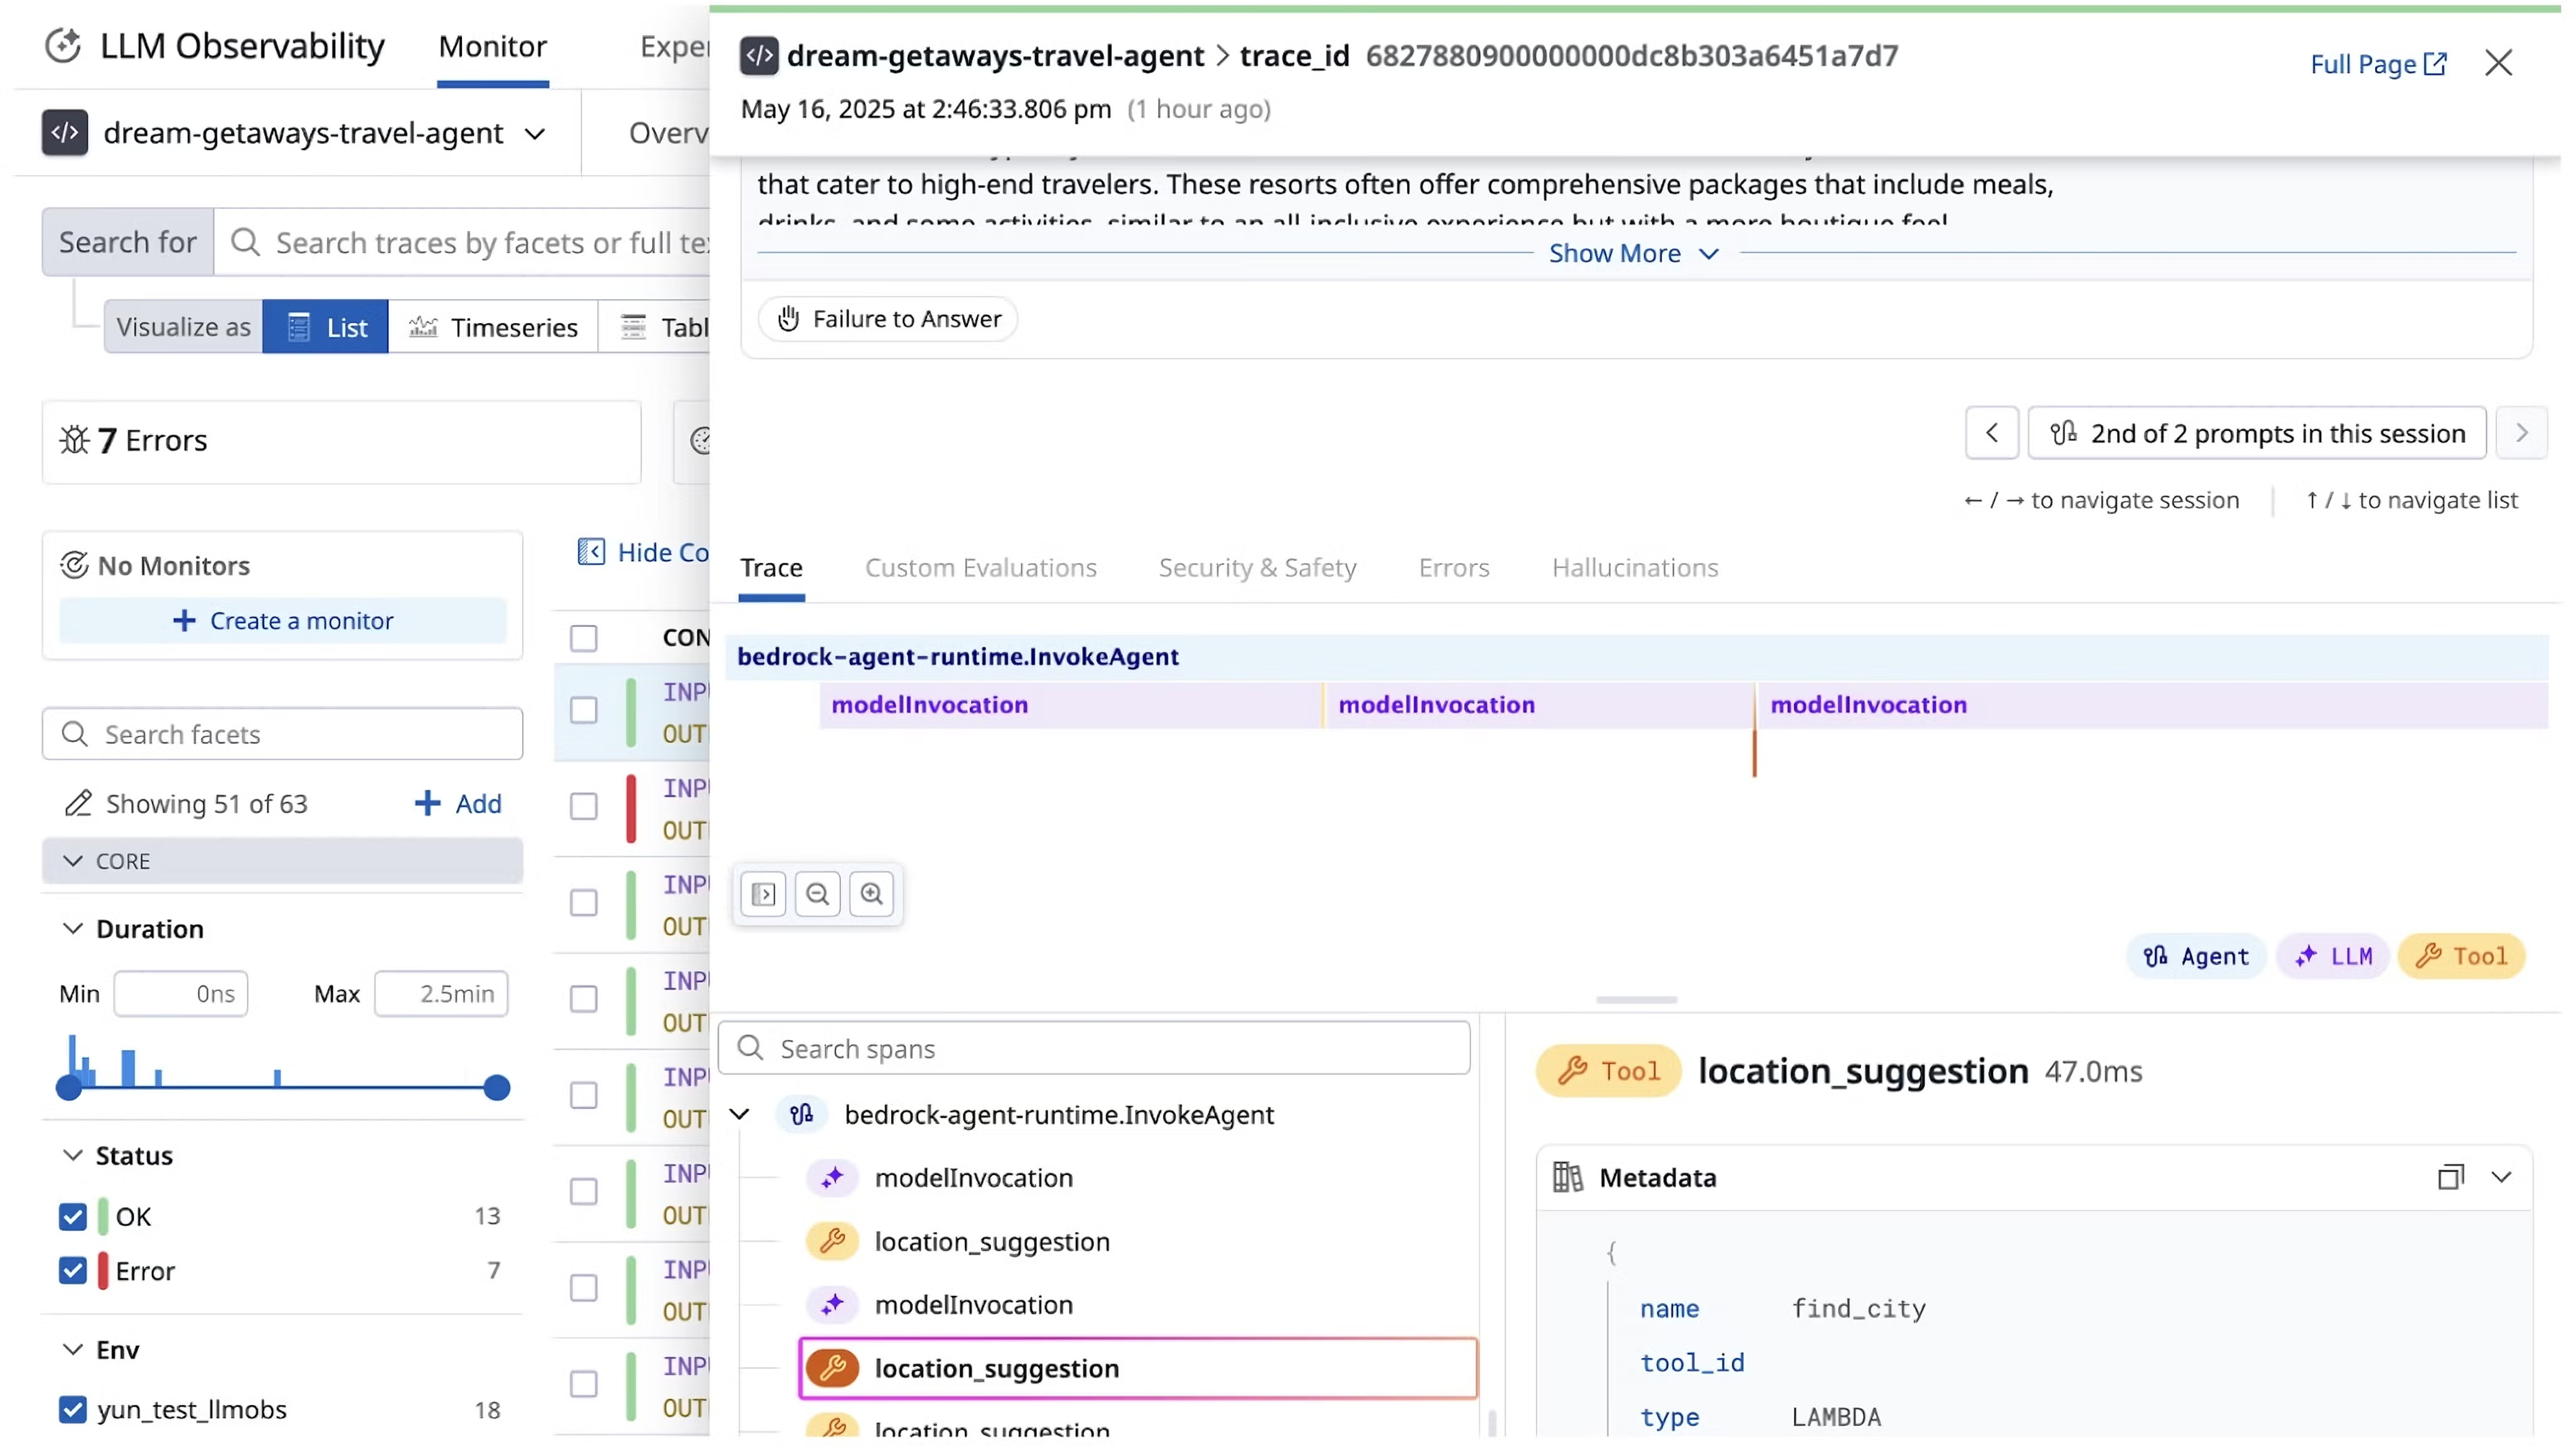
Datadog Agent Observability brings AI-specific traces into a platform already used for application and infrastructure monitoring.
Agent requests can contain spans for model calls, tools, preprocessing, and other workflow steps, alongside latency, errors, token usage, and estimated model cost. Datadog can also correlate Agent Observability spans with standard APM traces, so the same problem can be investigated across the agent workflow and the application services involved.
Evaluations can operate at span, trace, or session level, with managed checks, custom LLM judges, end-user feedback, and externally generated scores available through the platform.
Applications can send telemetry through Datadog SDKs, its HTTP API, or OpenTelemetry. Memory operations implemented by the application can be represented through custom instrumentation when those reads or writes are needed inside the execution record.
8. AgentOps
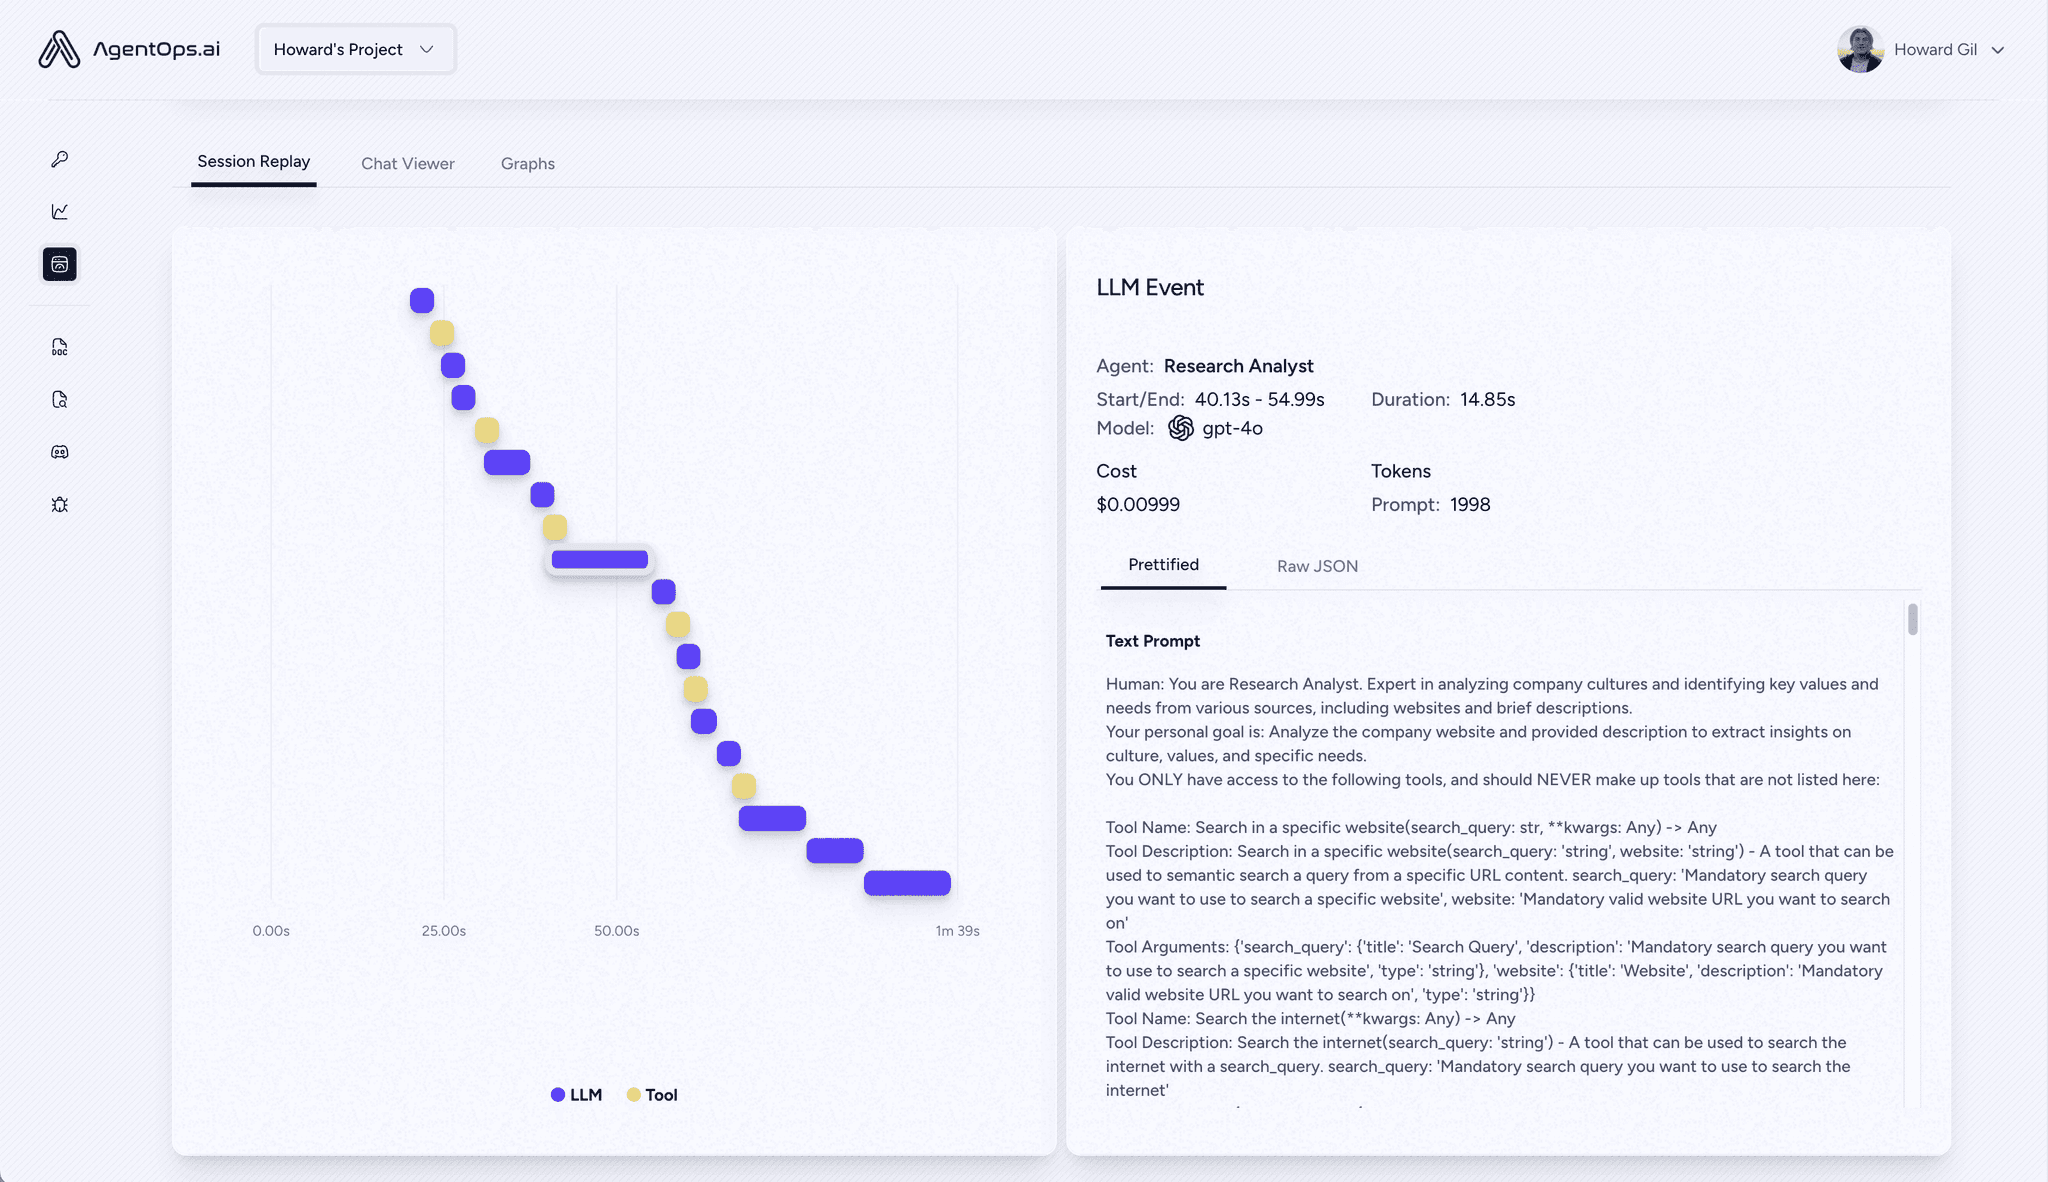
AgentOps is an MIT-licensed observability platform designed around agent execution.
Sessions, agents, workflows, operations, LLM calls, and tools each get their own place in AgentOps's span hierarchy. Automatic instrumentation and decorators can be used for supported providers and custom agent logic, then the resulting run can be inspected as a timeline or execution tree.
That hierarchy also gives application-specific operations a clear place in the trace. A memory lookup, for example, can be represented as an operation with its input, output, timing, and relevant metadata instead of disappearing inside a generic agent step.
AgentOps provides a hosted service and documents self-hosted deployments through Docker and Kubernetes.
Honorable Mention: Respan
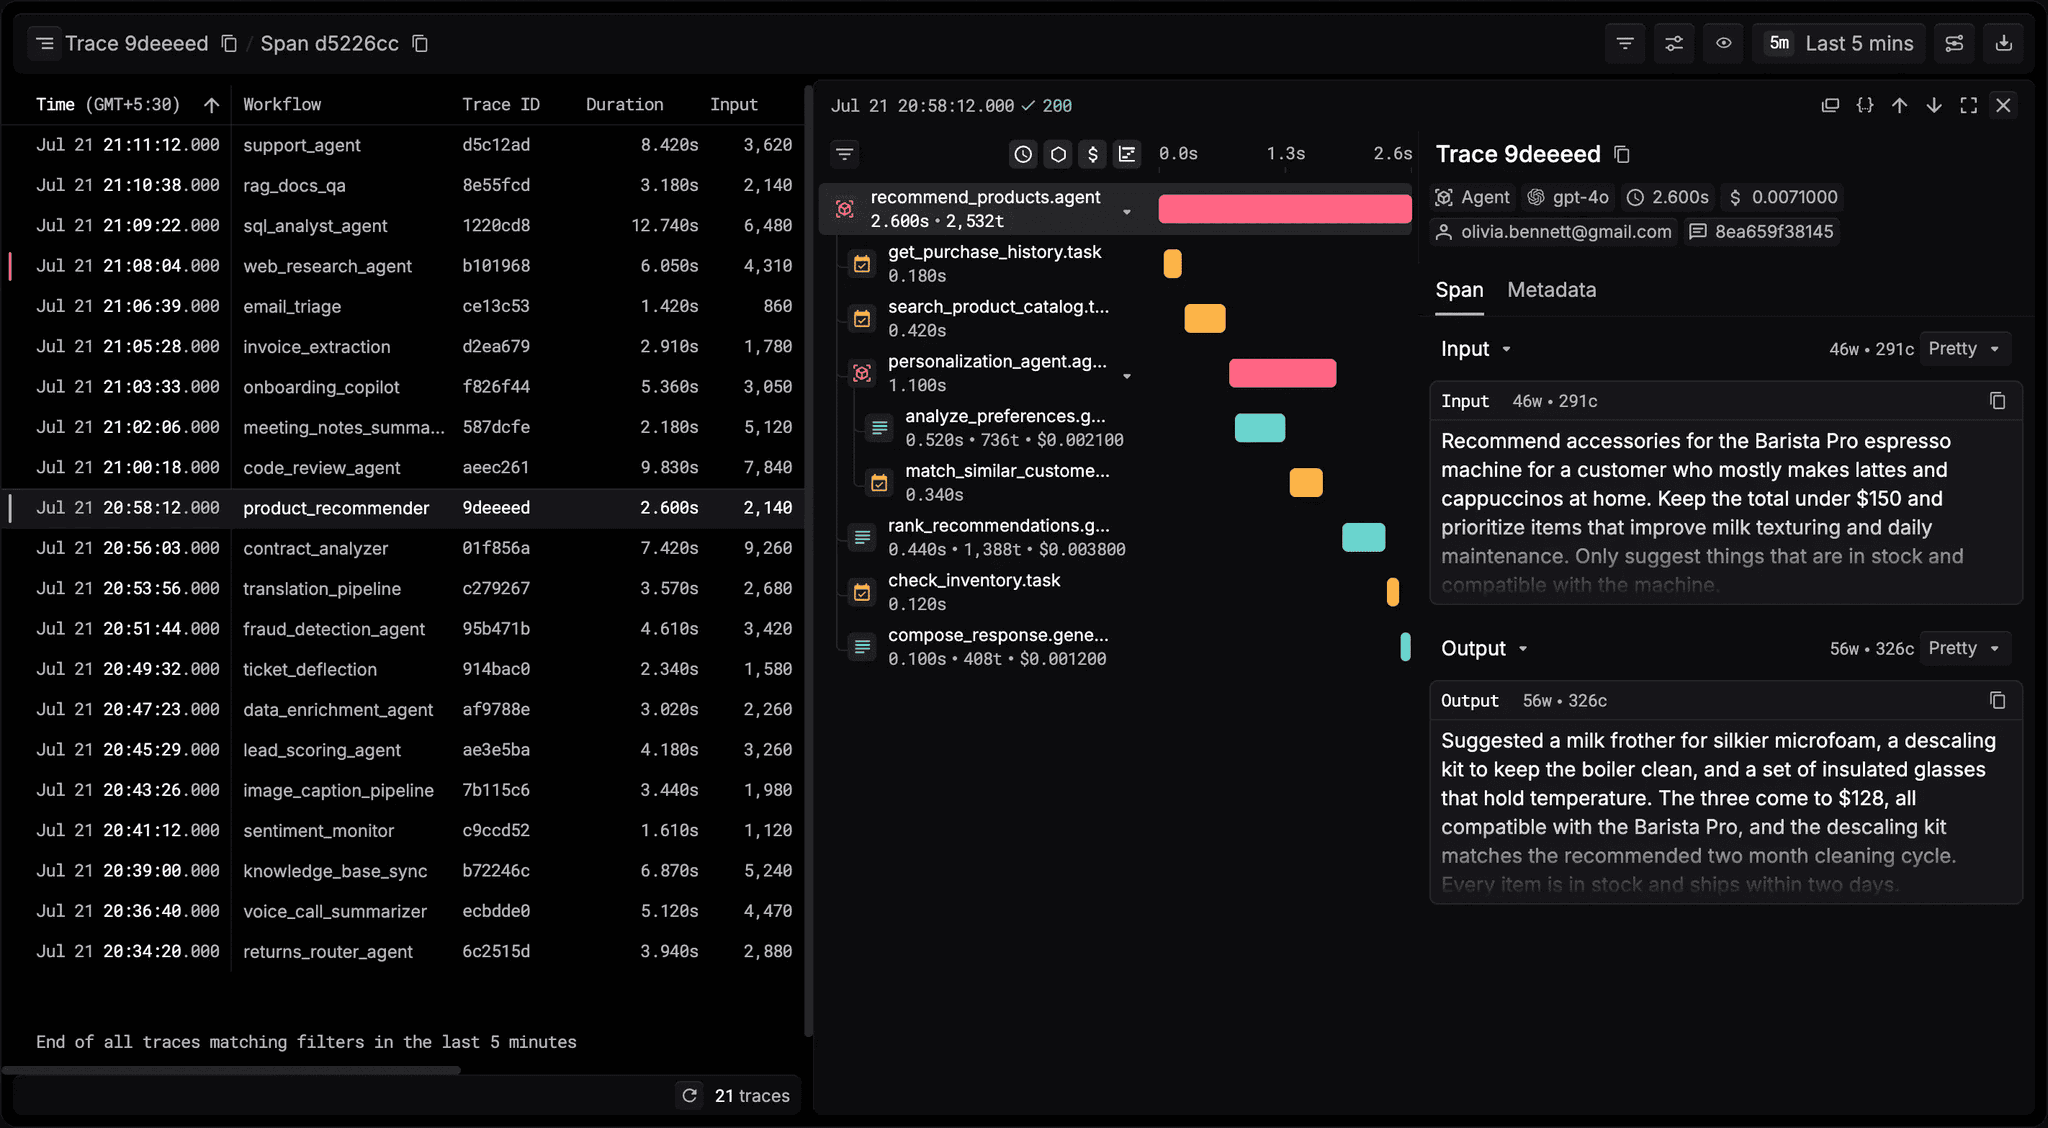
Respan (formerly Keywords AI) combines LLM and agent observability with logging, evaluations, and model-gateway infrastructure. Requests can carry identifiers and metadata that connect model activity with users, groups, or application-specific context.
It also has a direct cognee integration, which connects cognee's @observe abstraction with Respan's task and workflow spans, allowing memory pipelines to emit tracing data through the same observability interface used elsewhere in cognee.
Tracing Memory Reads and Writes
Stateful agents can make decisions using information that was recorded in an earlier task or session. Reconstructing those decisions requires more than knowing that a retrieval operation returned successfully.
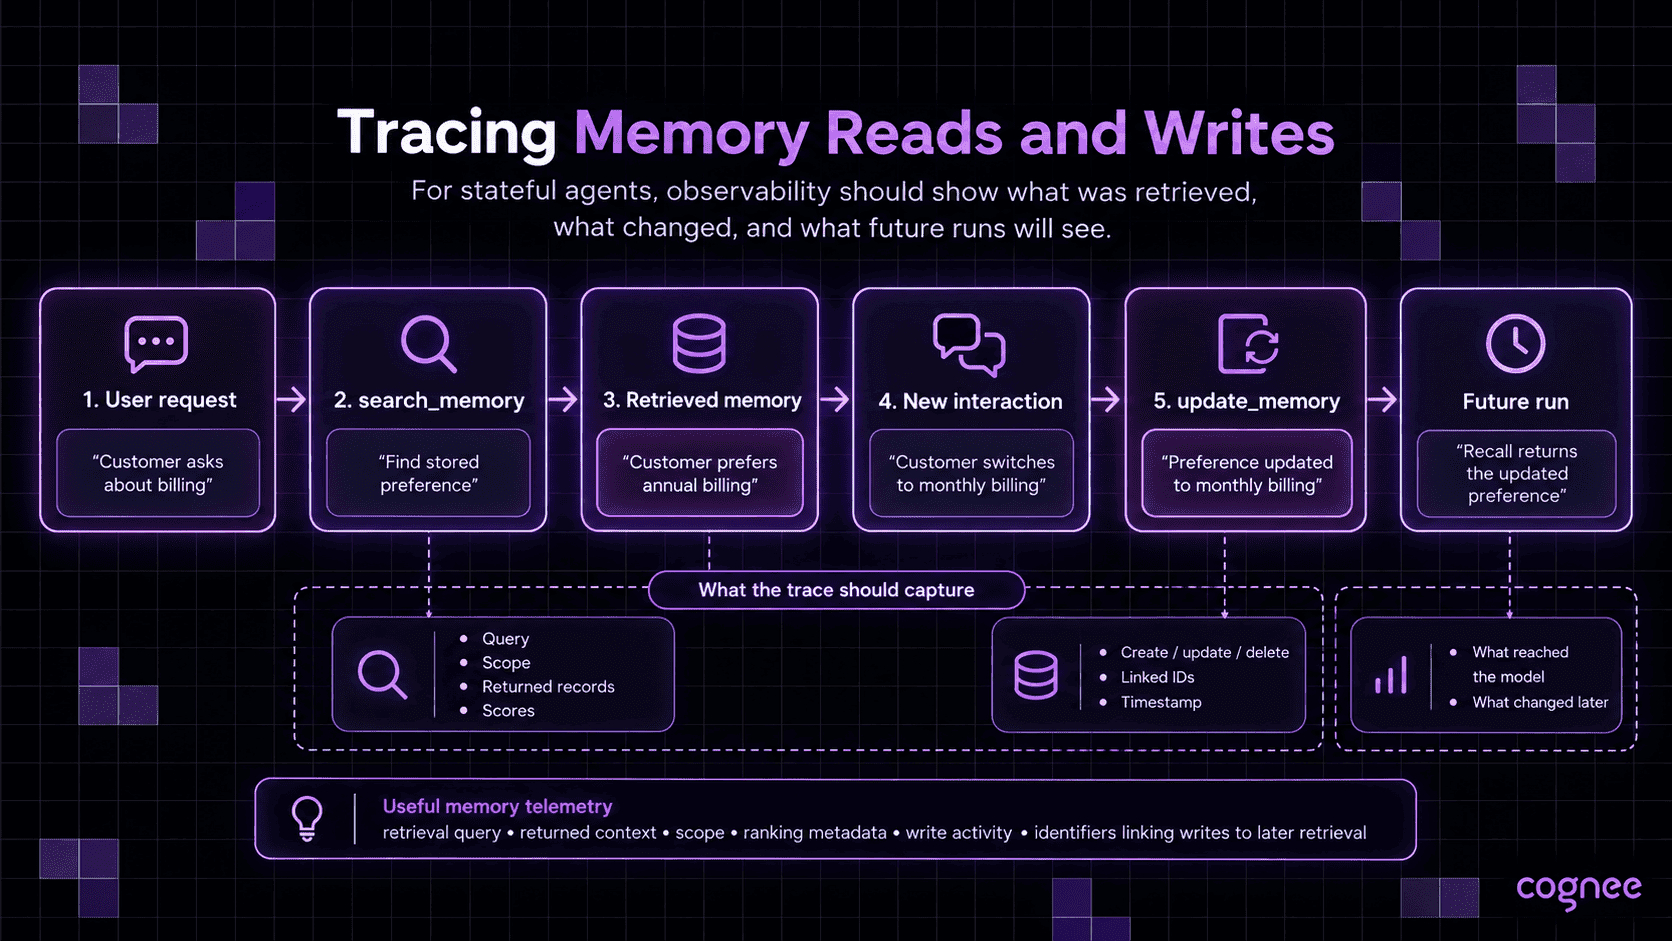
If an agent retrieves a stored preference such as:
Customer prefers annual billing.
And the customer switches to monthly billing during the interaction, the agent will record the updated preference before the session ends.
A trace showing only a successful search and successful write leaves several pieces of the execution unexplained. Relevant telemetry can include:
- the memory or retrieval query;
- which records or graph context were returned;
- user, dataset, agent, or session scope;
- retrieval scores or ranking metadata where available;
- memory creation, update, or deletion activity;
- identifiers connecting a write with later retrieval.
For an agent with persistent memory, those fields help reconstruct the information that entered the context earlier and how the current run changed what future runs can retrieve.
But visibility alone doesn't measure memory quality. A trace can show which record was retrieved and how it was ranked; only evaluation can determine whether it was the right memory for the query. AI memory benchmarks like BEAM evaluate retrieval and memory behavior more directly, while observability provides the execution history needed to investigate individual failures.
As the OpenTelemetry GenAI conventions mature, that operation vocabulary gives instrumentation libraries and observability backends a shared way to represent memory activity, superseding the custom or generic spans most platforms in this comparison currently rely on.
Choosing Among AI Observability Tools for Stateful Agents
What's already in the stack often decides which platform makes sense:
- If LangChain or LangGraph is already in use, LangSmith offers direct integrations with both.
- Langfuse, Opik, AgentOps, and Phoenix provide different self-managed deployment and licensing models.
- If evaluation is already built into the development workflow, Braintrust, Opik, Phoenix, Weave, LangSmith, and Langfuse offer different ways to turn traces into datasets, automated scores, and repeatable experiments.
- If Datadog already handles APM and infrastructure monitoring, agent telemetry can be correlated with those existing traces in the same platform.
A representative agent run reveals more than a feature table: instrument the same workflow across a short list of candidates, introduce a retrieval or tool failure, and compare how clearly each trace identifies the operation responsible.
In stateful agents, observability records what was retrieved, which stored information entered context, what changed afterward, and how those operations influenced later actions. The memory layer, meanwhile, controls what persists across tasks, how stored information is revised, and what returns later.
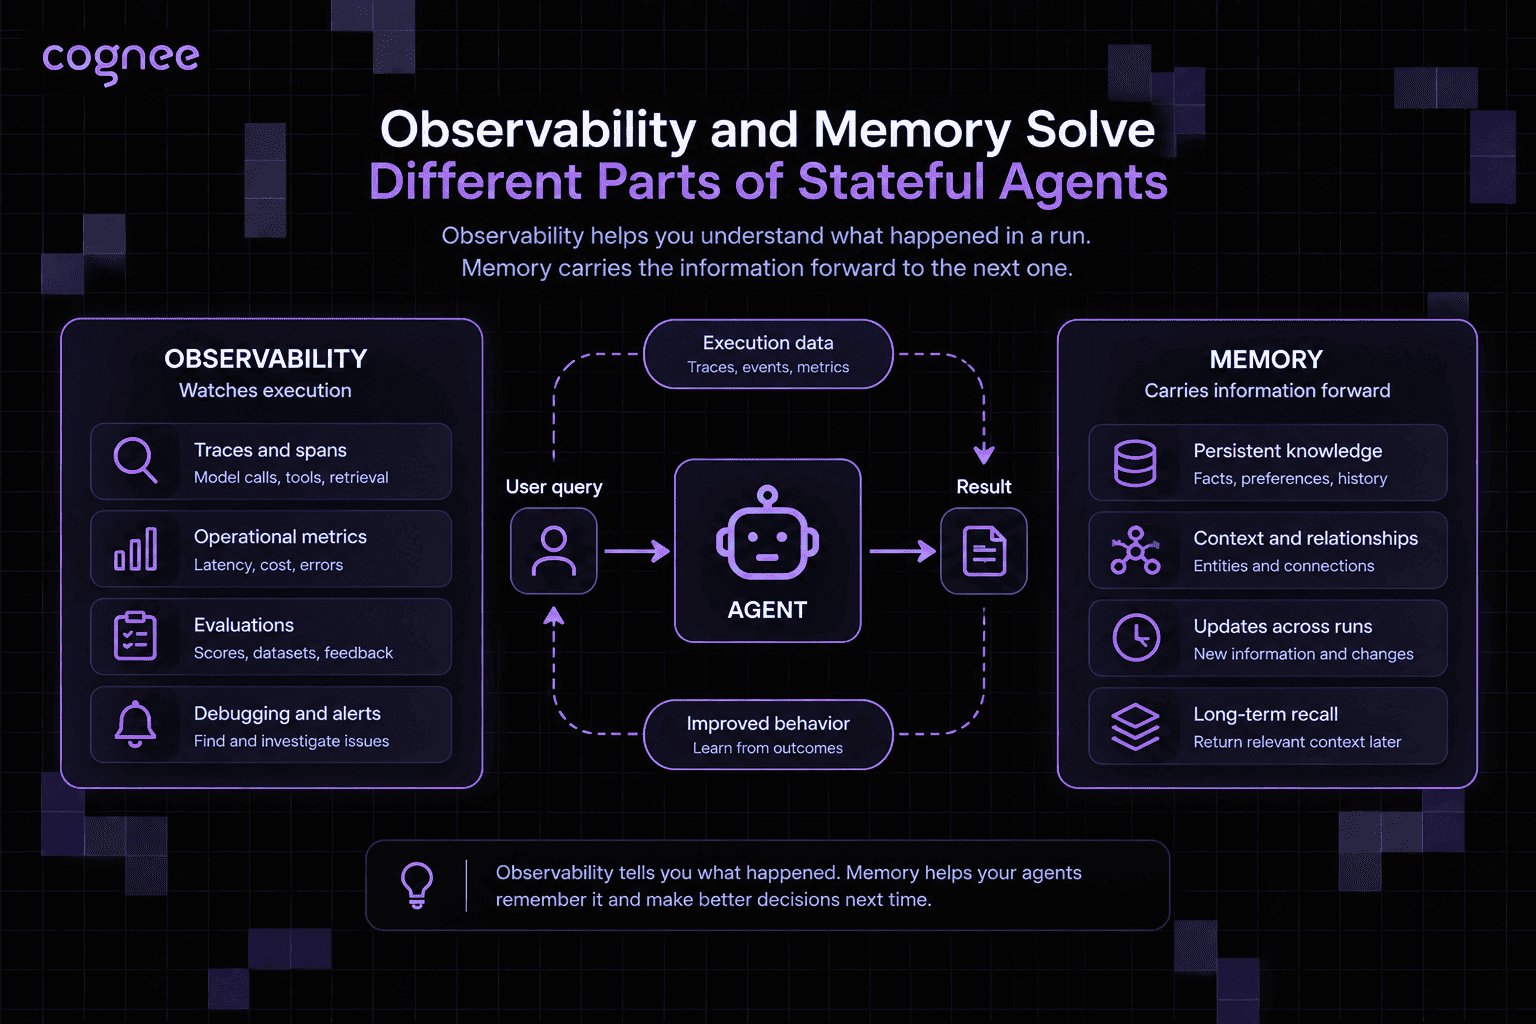
These memory operations need the same traceability as the model, retrieval, and tool calls around them.
FAQ
Answers to the most common questions from this guide.
Should agent traces contain the full prompt, retrieved context, and memory contents?
Only when that level of detail is appropriate for the application. Full inputs and outputs can make debugging easier, but they can also contain customer data, credentials, proprietary documents, or other sensitive information.
Production instrumentation should support redaction, sampling, access controls, and configurable payload capture. In some systems, identifiers, metadata, hashes, or retrieval references provide enough information to reconstruct an event without copying the complete source content into the observability platform.
How long should AI agent traces be retained?
There's no universal retention period. Historical traces can support debugging and evaluation, while privacy requirements, storage costs, contractual obligations, and organizational retention policies can limit how long detailed execution data should be kept.
Trace metadata and full payloads can also follow different retention policies. Aggregate latency, cost, error, and evaluation data can often be preserved without keeping prompts, retrieved documents, tool responses, or memory contents for the same period.
Do AI observability tools replace application performance monitoring?
Usually not. Agent observability focuses on AI-specific execution such as model calls, retrieval, tools, agent trajectories, and evaluations. Application performance monitoring covers the services, databases, queues, networks, and infrastructure executing those operations.
Connecting the two can make root-cause analysis easier. A slow retrieval step, for example, can be investigated both as part of the agent trajectory and through the database or service traces responsible for executing it.