Announcing the new cognee UI: Local & Cloud Notebooks, Graph Explorer

TL;DR: The new cognee UI makes building AI memory simple. Instead of juggling Python scripts, you use a consistent interface to load and process data—and you can deploy to the cloud in seconds. It’s faster to work with, easier to manage, and more accessible.
Why we built it
Modern data stacks (think DuckDB and Motherduck) prove that local and cloud workflows should connect. Storage is a commodity; let each side scale independently and stop buying big database machines just to hold embeddings you’ll never read.
Meanwhile, hosted vector/graph databases often create vendor lock-in. Many systems can’t share catalogs or structures—unlike the convergence happening in the data world with Apache Iceberg and Delta Lake concepts.
In practice, people want different databases, LLMs, and agentic flows for different jobs. Simple RAG works by piling more data into a collection, but anything beyond that turns into fragile scripts, update logic, and dependency hell.
We also learned something else: a good UI goes a long way. After (unsuccessfully) trying to keep everyone off ChatGPT Teams to focus on agentic flows, we embraced the simplicity of a clear, honest interface. It’s a safe, efficient way to manage large datasets. Once data enters cognee, it makes sense to operate on it with a click in a lightweight notebook.
Meet the cognee UI
Starting with cognee v0.3.3, a local web UI ships out of the box. Launch it with:
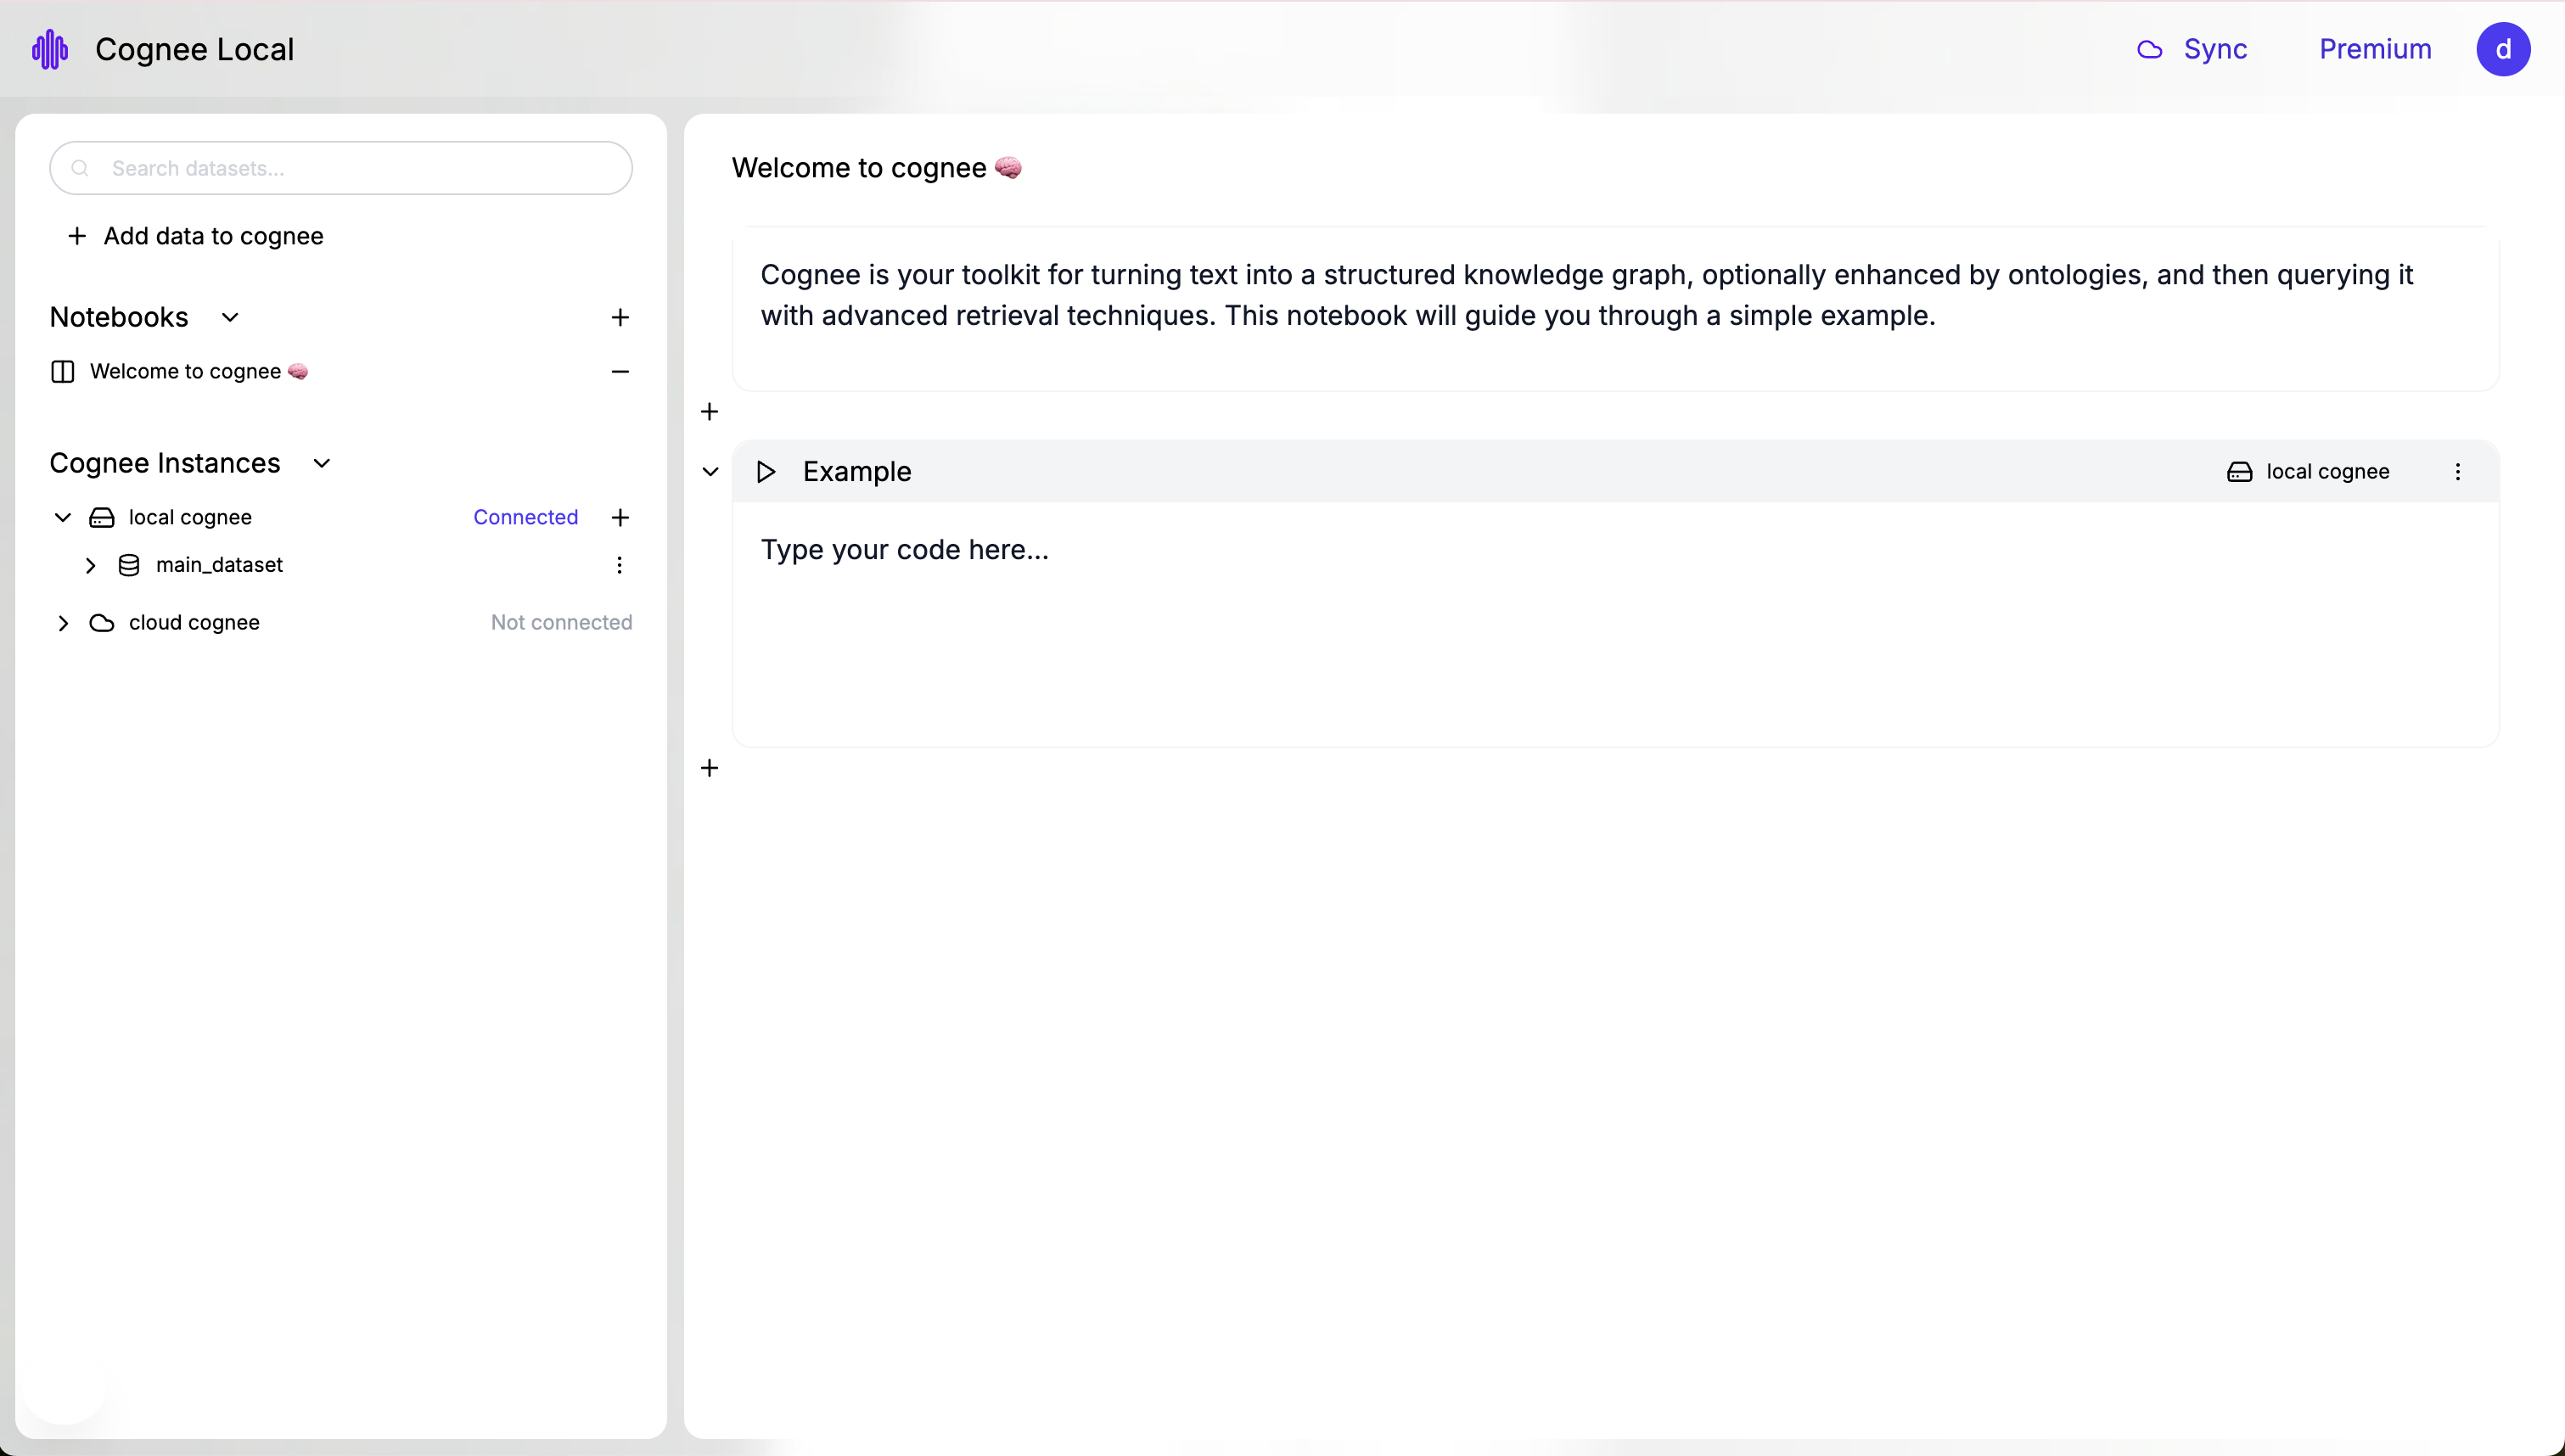
This starts both frontend and backend and prints the URLs for you to access.
The UI uses interactive notebooks to run cognee methods, tasks, pipelines, and custom logic—and to show query results.
Core ideas
- The notebook runs locally, with local data.
- After you cognify, you can query with our search.
- Prefer buttons when you want speed; prefer code when you want control.
- Add data → button (add + cognify)
- Or in a code cell: cognee.add(), cognee.cognify()
Features
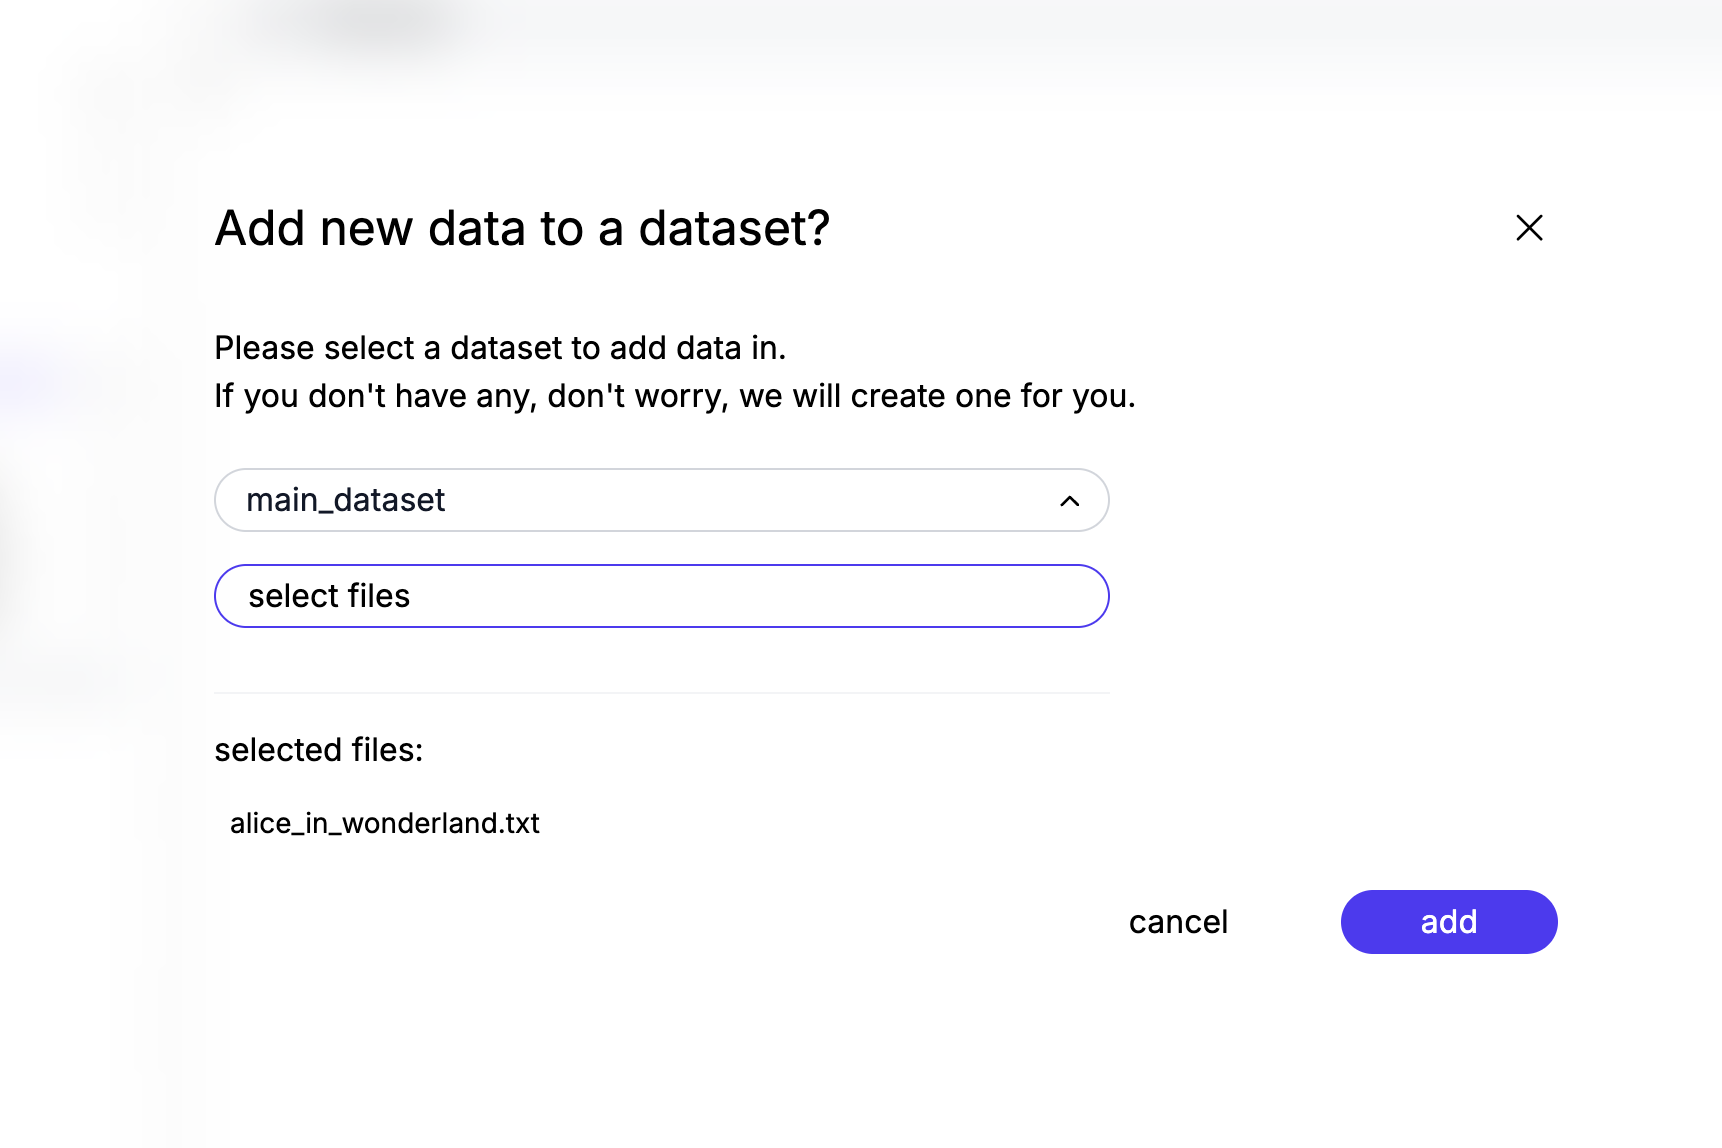
1) Add data button
A guided flow to load files and immediately cognify them.
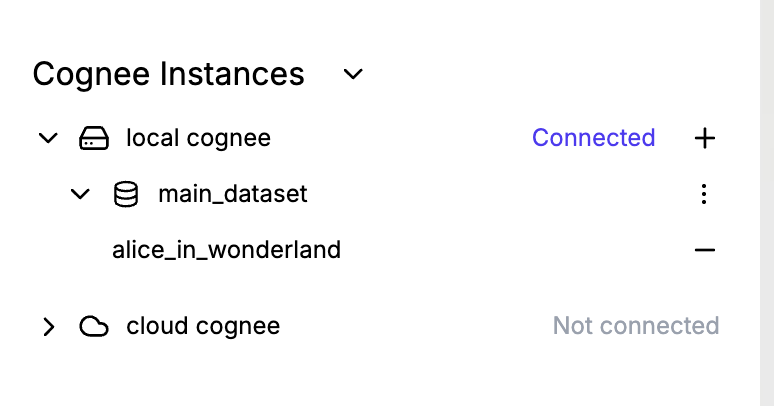
2) Datasets
See all attached datasets on the left—in-memory databases and any files you’ve loaded.
You can connect and sync with your Cognee Cloud and view those datasets alongside local ones in the same interface, then manage everything together.
3) Notebooks
Organize work into named notebooks. Each cell can execute one or more statements.
4) Graph Explorer
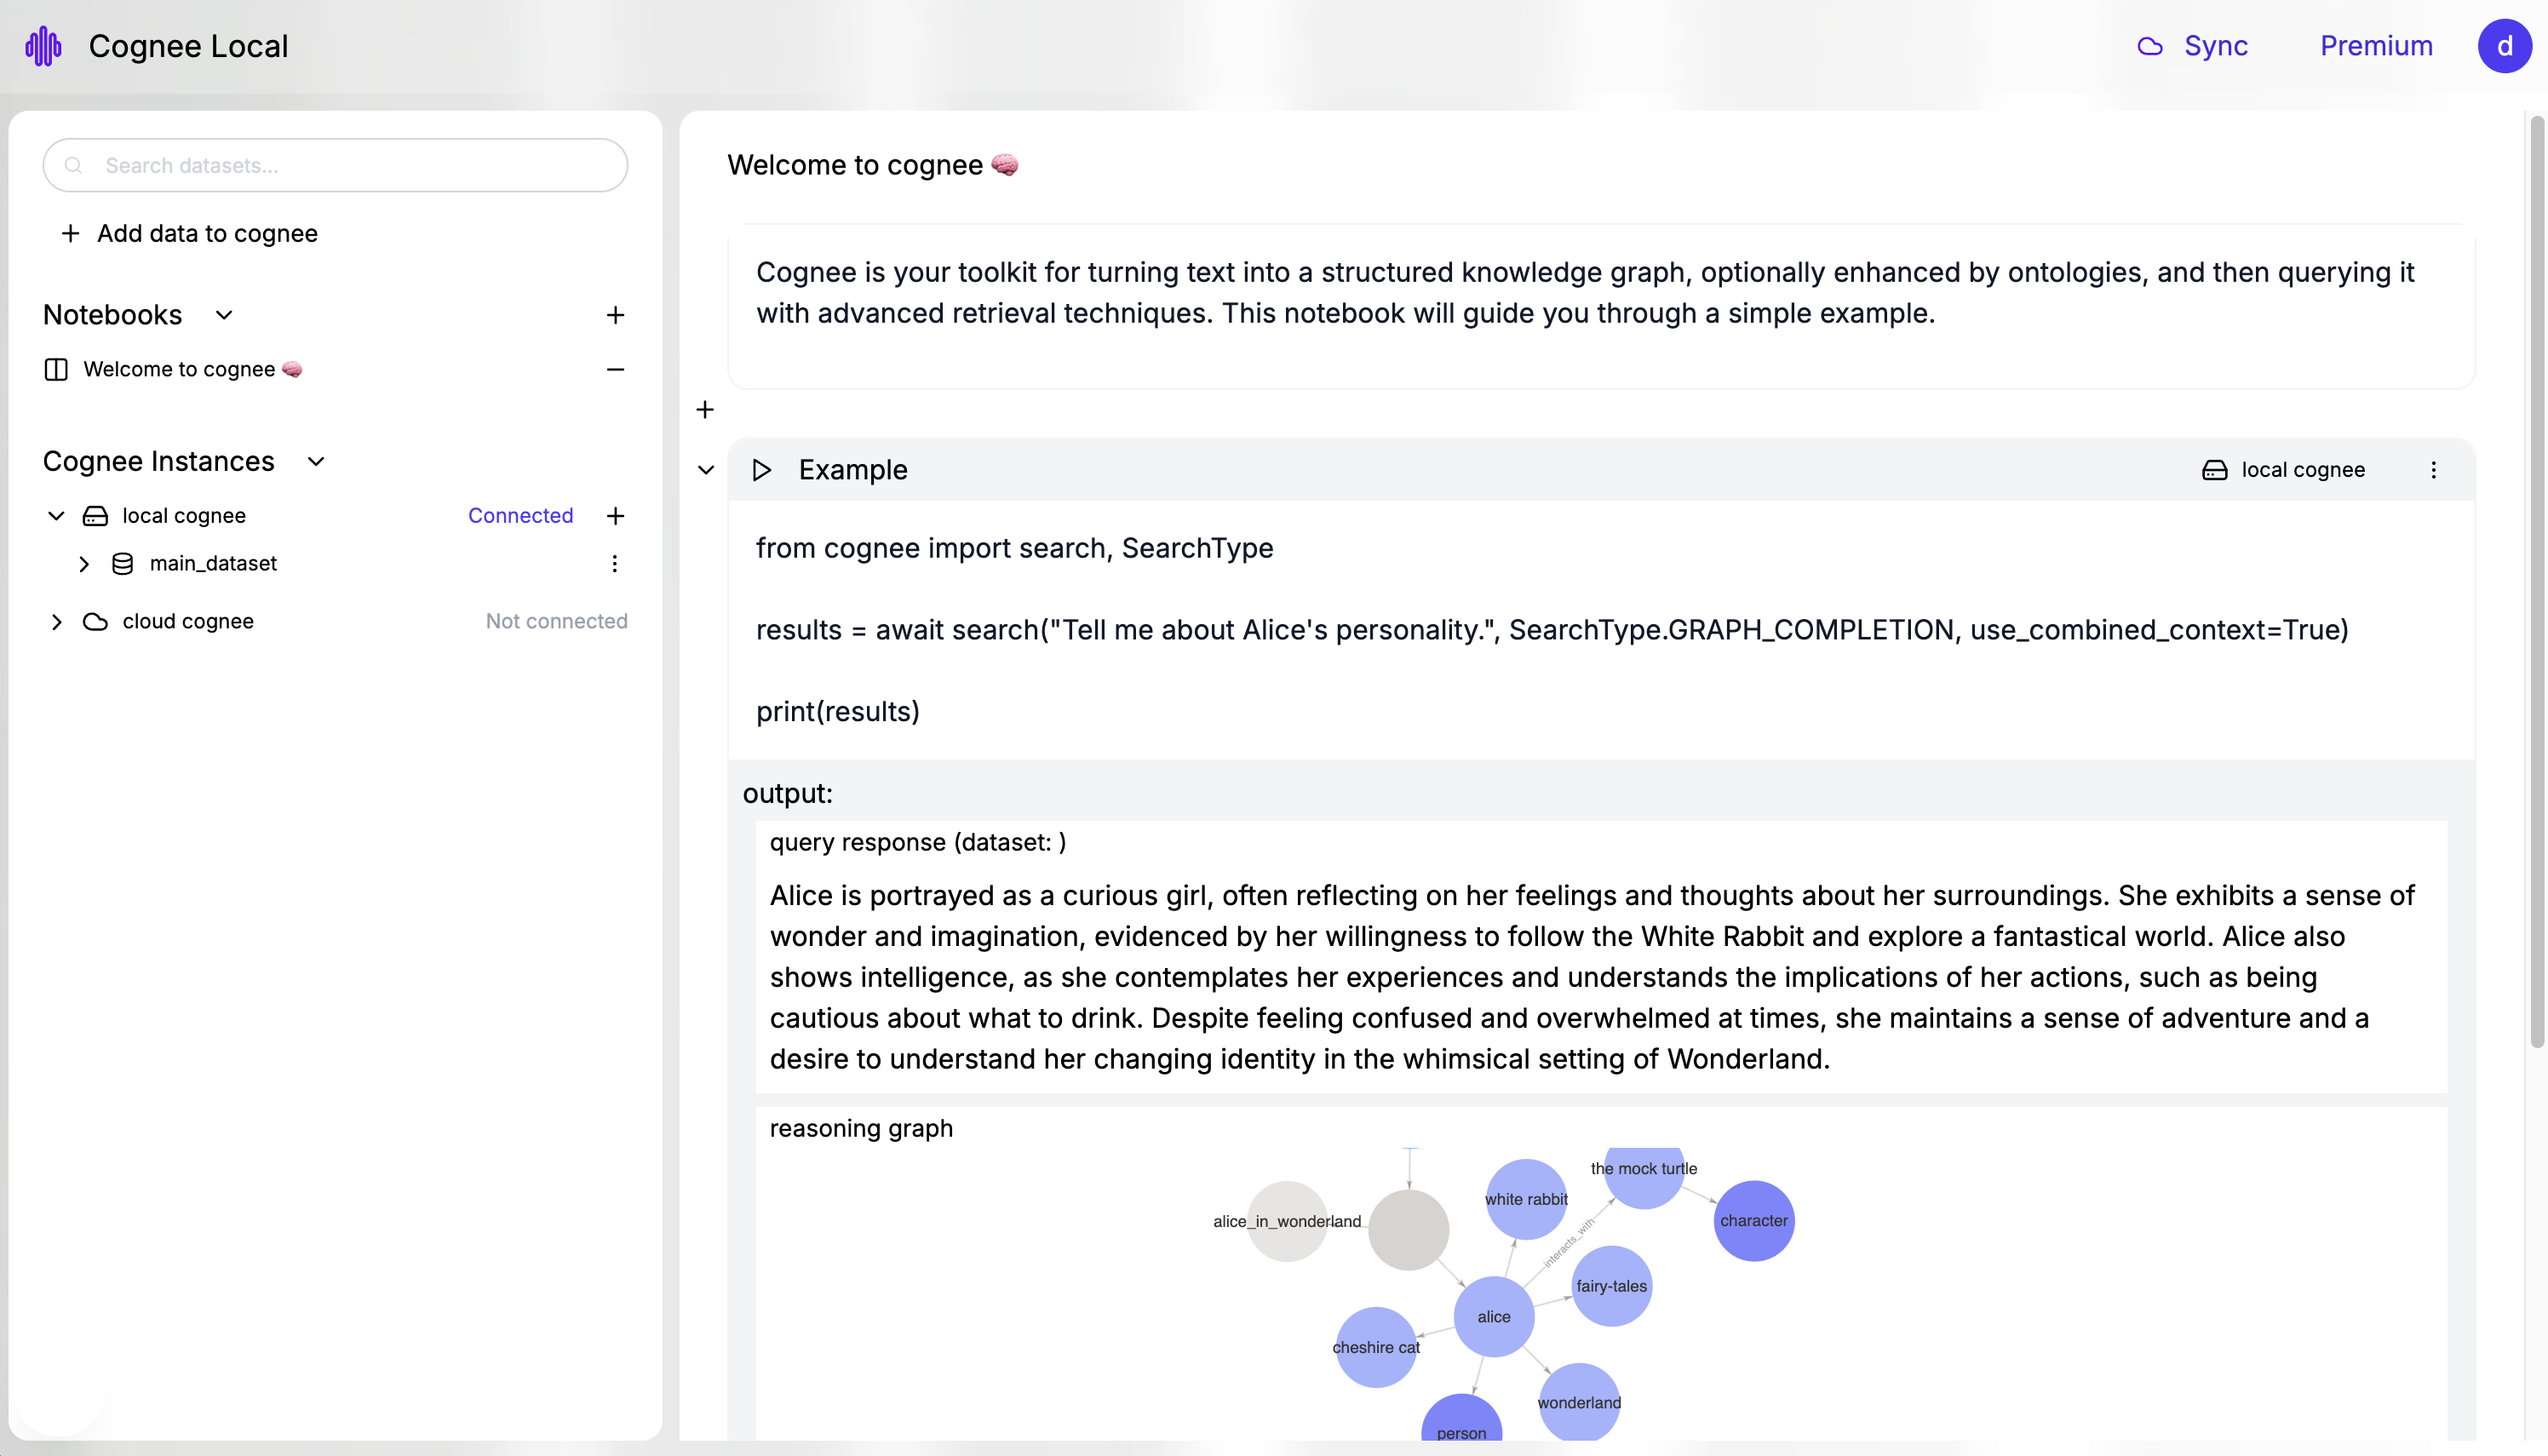
In the output panel, the Graph Explorer visualizes the reasoning memory—the subgraph used for reasoning.
Use the use_combined_context=True parameter in search to enable the visualization.
Quick Run Through
1- First, export your LLM API key:
2- Start with:
3- click "+ Add data to cognee"
4- Run the following on your code cell:
When run in the UI, you’ll see the query response and the reasoning graph in the explorer.
That’s it
The new cognee UI gives you a clear, unified way to add data, process it, explore graphs, and query—all locally, with cloud deployment possibility in seconds. This is just a beginning. Stay tuned for the next releases.


